Download

1 / 11
110 likes | 177 Views
Learn about the Least Squares Line and how it minimizes errors in linear modeling. Explore correlation coefficients and fitting data effectively.

E N D
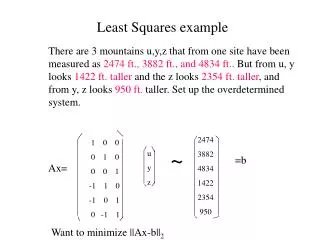
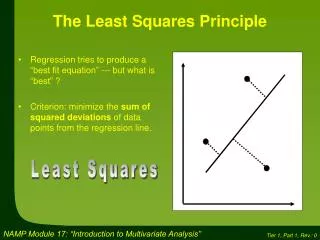
Source: http://www.studyworksonline.com, 8/13/03 Many lines appear to fit the data well.
Source: http://www.studyworksonline.com, 8/13/03 Many lines appear to fit the data well.
Source: http://www.studyworksonline.com, 8/13/03 Many lines appear to fit the data well.
Source: http://www.studyworksonline.com, 8/13/03 Many lines appear to fit the data well.
Source: http://www.studyworksonline.com, 8/13/03 Many lines appear to fit the data well.
Source: http://www.studyworksonline.com, 8/13/03 Many lines appear to fit the data well. There is one line that is often said to fit the best(especially when there are no outliers)The Least Squares Line Error2 Actual Actual – Predicted = Error Predicted
Source: http://www.studyworksonline.com, 8/13/03 Least-Squares Line The Least Squares Line is the line that minimizes the sum of the squares of the errors.
Least-Squares Line We have qualitative ways of expressing how appropriate the linear model is like “a very appropriate model”, or “ a fairly appropriate model”, or “ an inappropriate model”. There is also a quantitative way to express the “goodness of fit” called the correlation coefficient, r. The correlation coefficient, r, measures the strength of the linear relationship between the two variables.