Download
1 / 35
350 likes | 367 Views
Learn to use quadratic functions to model, analyze, and predict data with regression. Understand identifying quadratic data and applying quadratic models. Practice with real-world examples to enhance understanding.

E N D
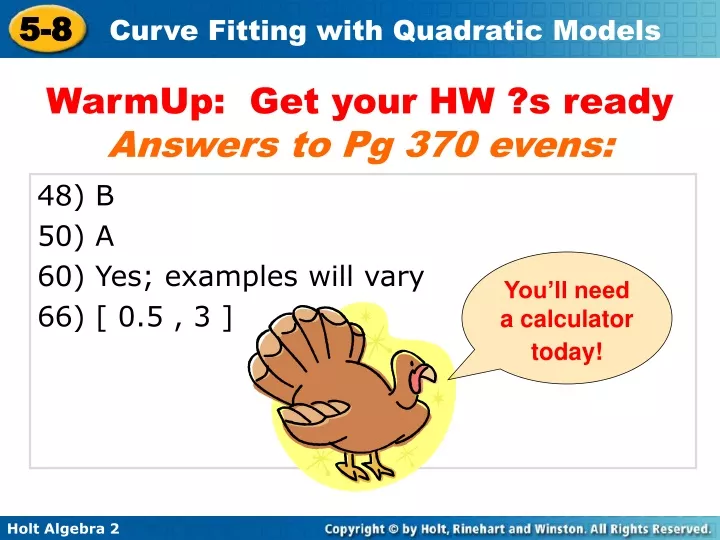
WarmUp: Get your HW ?s readyAnswers to Pg 370 evens: 48) B 50) A 60) Yes; examples will vary 66) [ 0.5 , 3 ] You’ll need a calculatortoday!
Objectives Use quadratic functions to model data. Use quadratic models to analyze and predict.
Vocabulary quadratic model quadratic regression
For a set of ordered parts with equally spaced x-values, a quadratic function has constant nonzero second differences, as shown below.
Example 1: Identifying Quadratic Data Determine whether the data set could represent a quadratic function. Explain. Find the first and second differences.
Example 1: Identifying Quadratic Data Determine whether the data set could represent a quadratic function. Explain. Equally spaced x-values Quadratic function: second differences are constant for equally spaced x-values 1st 2 6 10 14 2nd 4 4 4
On Your Own Determine whether the data set could represent a quadratic function. Explain. Find the first and second differences.
On Your Own Determine whether the data set could represent a quadratic function. Explain. Equally spaced x-values Quadratic function: second differences are constant for equally spaced x-values 1st 10 14 18 22 2nd 4 4 4
On Your Own Determine whether the data set could represent a quadratic function. Explain. Find the first and second differences.
On Your Own Determine whether the data set could represent a quadratic function. Explain. Equally spaced x-values Not a quadratic function: first differences are constant so the function is linear. 1st 2 222 2nd 0 0 0
What if the data came from the real world? Would it be okay if the 2nd differences weren’t exactly equal?
A quadratic model is a quadratic function that represents a real data set. Models are useful for making estimates. In Chapter 2, you used a graphing calculator to perform a linear regression and make predictions. You can apply a similar statistical method to make a quadratic model for a given data set using quadratic regression.
Example 3: Consumer Application The table shows the cost of circular plastic wading pools based on the pool’s diameter. Find a quadratic model for the cost of the pool, given its diameter. Use the model to estimate the cost of the pool with a diameter of 8 ft.
Example 3 Continued Step 1 Enter the data into two lists in a graphing calculator. Press: S e to Edit…
Example 3 Continued Step 2 Use the quadratic regression feature. Press: î to get back to the main screenS> CALC5:QuadReg e You may not see R2, depending on your calculator’s settings. It tells you how good the model is for the data. R2 = 1 is perfect.
Example 3 Continued A quadratic model is f(x) ≈ 2.4x2 – 21.6x + 67.6, where x is the diameter in feet and f(x) is the cost in dollars.
Example 3 Continued Step 3 Type the model into !. DO NOT ROUND! You may have to adjust the @ settings. Use $ to verify that the model fits the data.
Example 3: Consumer Application The table shows the cost of circular plastic wading pools based on the pool’s diameter. Find a quadratic model for the cost of the pool, given its diameter. Use the model to estimate the cost of the pool with a diameter of 8 ft.
Example 3 Continued Step 4 Use the table feature to find the function value for x = 8.
Example 3 Continued A quadratic model is f(x) ≈ 2.4x2 – 21.6x + 67.6, where x is the diameter in feet and f(x) is the cost in dollars. For a diameter of 8 ft, the model estimates a cost of about $49.54.
Example 3 Continued What if the largest pool for sale cost $195.00? What would be its diameter, according to the model? Use the equation (rounding to the tenth is okay): f(x) ≈ 2.4x2 – 21.6x + 67.6, where x is the diameter in feet and f(x) is the cost in dollars.
Example 3 Continued 195 = 2.4x2 – 21.6x + 67.6 0 = 2.4x2 – 21.6x – 127.4
Example 3 Continued What if the largest pool for sale cost $195.00? What would be its diameter, according to the model? The diameter of a pool that costs $195 would be about 13.1 feet.
On Your Own The table shows the prices of an ice cream cake, depending on its size. Find a quadratic model for the cost of an ice cream cake, given the diameter. Then use the model to predict the cost of an ice cream cake with a diameter of 18 in.
On Your Own f(x) –0.011x2 + 1.43x – 0.67; f(18) $21.51
there’s one more example if there’s time… we can also start homework in class
Check It Out! Example 3 The tables shows approximate run times for 16 mm films, given the diameter of the film on the reel. Find a quadratic model for the reel length given the diameter of the film. Use the model to estimate the reel length for an 8-inch-diameter film.
Check It Out! Example 4 Continued Step 1 Enter the data into two lists in a graphing calculator. Step 2 Use the quadratic regression feature.
Check It Out! Example 4 Continued Step 3 Graph the data and function model to verify that the model fits the data. Step 4 Use the table feature to find the function value x = 8.
Check It Out! Example 4 Continued A quadratic model is L(d) 14.3d2 – 112.4d + 430.1, where d is the diameter in inches and L(d) is the reel length. For a diameter of 8 in., the model estimates the reel length to be about 446 ft.
Lesson Quiz: Part I Determine whether each data set could represent a quadratic function. 1. not quadratic quadratic 2.