Download
1 / 51
530 likes | 806 Views
CIS 410/510: Introduction to Scientific Visualization. Hank Childs, University of Oregon. October 2nd, 2013. Outline. Class Overview (Syllabus) Overview of Visualization: Scientific Visualization versus Information Visualization The Very Basics of Computer Graphics

E N D
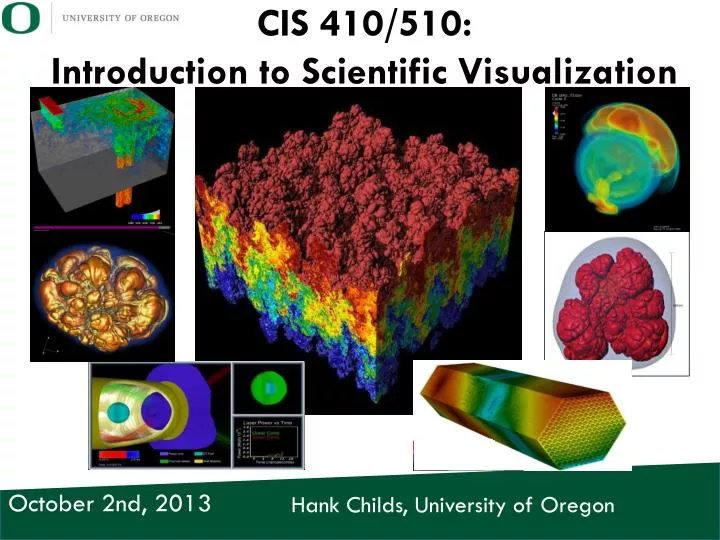
CIS 410/510: Introduction to Scientific Visualization Hank Childs, University of Oregon October 2nd, 2013
Outline Class Overview (Syllabus) Overview of Visualization: Scientific Visualization versus Information Visualization The Very Basics of Computer Graphics Project 1 Overview
Outline Class Overview (Syllabus) Overview of Visualization: Scientific Visualization versus Information Visualization The Very Basics of Computer Graphics Project 1 Overview
Syllabus is Online • http://ix.cs.uoregon.edu/~hank/410
Prerequisites For This Course • CIS 330 is the only prerequisite • Waived for anyone who has good C++ knowledge • CIS 441 is not a prerequisite
Enrolling In This Class • Expected ~15 to enroll • We have 40 enrolled • I have a plan for dealing with this • No TA available though • … and there are a lot of leaders in this class • Additions will be made only if: • Enrolled students drop • You have a really good case for why this class will help you
Grading • Introductory Projects: 45% • Advanced Project: 35% • Quizzes: 20% • Extra credit through: • Unused late passes • Community participation
Advanced Projects • Two tracks: • Custom project • Pre-defined project
Custom Project • You design and implement a project involving visualization • Milestones: • Proposal: November 15th (3% of grade) • Implementation: Dec 12th (27% of grade) • Presentation: Dec 12th (5% of grade)
Pre-defined Project • Ray-casted volume rendering • 35% of grade • There will be a grading rubric that outlines different levels of complexity • Also: attend project presentations for custom project • -4% of grade if missed
Language Used For This Class • The introductory projects will be implemented in C++. • Each project will start with a skeleton • The advanced project can be implemented in whatever you like.
Quizzes • Quiz #1 on advection (October 23rd): 10% • Quiz #2 on isosurfacing (November 1st): 10%
Expectations • This is a projects-driven class. • The projects will help you learn the theory and techniques behind scientific visualization, but they will also help you become better programmers, and provide you with experiences, anecdotes, and images that will impress potential employers. • The grading is designed to make sure you are keeping up with the assignments. • Staying on top of the projects will be critical to succeeding in this class.
Expectations • The projects in this class will be hard work. • It is difficult to quote exactly how much time, since there is variation in background and programming skill. • I expect those who have less developed programming skills will find this class to be a considerable effort, but also that they will have significant improvement by the end of the course.
Norms for this class Please ask questions Please ask me to slow down Please give feedback Please always bring paper and pencil/pen … we will do exercises during class
This Class In a Nutshell… 1st Half: Learn the basics behind scientific visualization 2nd Half: Advanced project Most of the learning will happen with projects. The lectures are designed to help you do the projects.
Course Materials • Textbook: The Visualization ToolKit. • PowerPoint lectures will be posted online. • Some lectures will be complemented with chalkboard exercises.
What is VTK? • VTK: Visualization ToolKit • Most popular visualization library in the world • We will use this for our introductory projects • Cross-platform, so you can use whatever development platform you please.
Office Hours • OH: Weds 10-11:30, Fri 12-1 • Location: 301 Deschutes (new!) • This week only: • Surge OH, Thurs 2-3
Working Together All projects are individual projects. Copying code from other students is cheating. However: I highly encourage you to discuss your roadblocks with each other and lean on each other to figure out solutions to your problems.
Working Together, part 2 • I have set up a forum on Piazza. • I will monitor (and respond) to the forum and encourage you all to do the same. • I may award extra creditto students who are particularly helpful on Piazza. • The amount of credit will vary based on involvement, with a maximum of 5%.
Evaluation Criteria • I will describe evaluation criteria on a project-by-project basis. • For the most part, • I give you: • the right answer • a differencing program • And ask that you send me: • a screenshot of the differencing program showing you have no differences with the right answer • your source code
Evaluation Criteria, pt 2 • I withhold the right to provide reduced scores if I believe you have borrowed too much of your implementation from a peer, the internet, or other sources. • Although borrowing code from elsewhere is a great strategy in the real world, it is not going to help you learn scientific visualization or how to program. • I will be looking at your source code.
Late Passes • You have 2 "late passes." • Late passes allow you to turn in your project after the due date for full credit. • Submitting a project with a Weds deadline on Friday (i.e., two days later) costs one late pass. • Submitting a project with a Friday deadline on the following Weds (i.e., five days later) costs two late passes. • Projects with a Friday deadline can possibly be submitted on a Monday for one late pass, but my availability on Mondays is not guaranteed and you may be forced to wait until Weds (and pay two late passes). • If you run out of late passes, then you may continue to earn half credit on any project. • Every unused late pass is worth 1% extra credit.
Class Summary This class will teach you the theory and techniques behind scientific visualization This class will improve your programming skills This class may help you land a job This class will require a lot of work
Grading (repeat of previous slide) • Introductory Projects: 45% • Advanced Project: 35% • Quizzes: 20% • Extra credit through: • Unused late passes • Community participation
Lecture hiccups • Unfortunate: travel on weeks 2 & 3 • Plan: • Week 2 • Kristi Potter on Weds, 10/9 • Normal lecture on Fri, 10/11 • Week 3 • Class canceled Weds, 10/16 • Normal lecture on Fri, 10/18 • Bonus lecture upcoming later in quarter • Also: faculty fireside
Lecture Plan • First six weeks are mapped out. • Last four weeks will be adaptive based on your project plans.
Outline Class Overview (Syllabus) Overview of Visualization: Scientific Visualization versus Information Visualization The Very Basics of Computer Graphics Project 1 Overview
Scientific Visualization • An interdisciplinary branch of science • primarily concerned with the visualization of three-dimensional phenomena (architectural, meteorological, medical, biological, etc.) • the emphasis is on realistic renderings of volumes, surfaces, illumination sources, and so forth, perhaps with a dynamic (time) component. • It is also considered a branch of computer science that is a subset of computer graphics. • The purpose of scientific visualization is to graphically illustrate scientific data to enable scientists to understand, illustrate, and glean insight from their data. Source: wikipedia
Information Visualization • The study of (interactive) visual representations of abstract data to reinforce human cognition. • The abstract data include both numerical and non-numerical data, such as text and geographic information. Source: wikipedia
SciVisvsInfoVis • “it’s infoviswhen the spatial representation is chosen, and it’s scivis when the spatial representation is given” (A) (C) (B) (D) (E)
What sorts of data? Of course, lots of other data too…
What Is Visualization Used For? • 3 Main Use Cases: • Communication • Confirmation • Exploration
How Visualization Works • Many visual metaphors for representing data • How to choose the right tool from the toolbox? • This course: • Describe the tools • Describe the systems that support the tools
This Class • Focus is on SciVis • We can add some InfoVis in the second half to fit advanced projects.
Outline Class Overview (Syllabus) Overview of Visualization: Scientific Visualization versus Information Visualization The Very Basics of Computer Graphics Project 1 Overview
Computer Graphics Defined: pictorial computer output produced, through the use of software, on a display screen, plotter, or printer.
What is computer graphics good for? • Ed Angel book: • Display of information • Design • Simulation and animation • User interfaces
The Basics of Using a Graphics System • You define: • Geometric primitives, typically a triangle mesh • Coloring for those geometry primitives • A model for a camera (where you are and what you are looking at) • And then: • Communicate this information using an interface (OpenGL) • And some package (GPU, Mesa) renders the scene • VTK will do this for us. • We will focus on transforming data to geometric primitives.
Outline Class Overview (Syllabus) Overview of Visualization: Scientific Visualization versus Information Visualization The Very Basics of Computer Graphics Project 1 Overview
Project #1 Goal: write a specific image Due: “Friday October 4th” “6am Saturday October 5th” % of grade: 2% Q: Why do I only get 2 days to complete this project? A: We need to need to get multi-platform issues shaken out ASAP. Experience last year was pretty good.
What is ? • Cmake is a cross-platform, open-source build system. • CMake is a family of tools designed to build, test and package software. • CMake is used to control the software compilation process using simple platform and compiler independent configuration files. • CMake generates native makefiles and workspaces that can be used in the compiler environment of your choice.
How do you install CMake? 2.8.11 Go to www.cmake.org & follow the directions
What is the ? The Visualization Toolkit (VTK) is an open-source, freely available software system for 3D computer graphics, image processing and visualization. VTK consists of a C++ class library and several interpreted interface layers including Tcl/Tk, Java, and Python. VTK is cross-platform and runs on Linux, Windows, Mac and Unix platforms.
How do you install VTK? Go to www.vtk.org , go to Resources->Download and follow the directions
How do you install VTK, part 2? • See if your favorite package manager has a version already. • Note: V5.8 or V5.10 is required. • Do not use V6.0
What do I do again? • Install CMake & VTK. • Download • “project1.cxx” from class website • “CMakeLists.txt” from class website • “data.vtk” from class website • Run CMake • Compile project1.cxx • Run program • Mail me screenshot of the result by 6am Sat. morning.
What should you do if you run into trouble? • Start with Piazza • Superstar students support (Room 100): • Thurs: 12-2 • Fri: 10-12 • OH this week: • Thurs: 2-3 • Fri: 12-1 • Email me: hank@cs.uoregon.edu