Download

1 / 60
610 likes | 832 Views
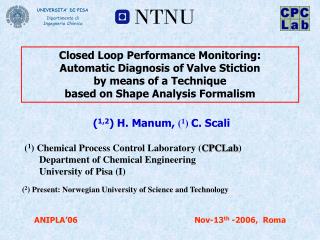
Session id: 40092. The Self-managing Database: Automatic Performance Diagnosis. Graham Wood Kyle Hailey Oracle Corporation. Problem Definition. Performance Diagnosis & Tuning is complex Diagnosis often requires additional data capture Database wide view of operations is lacking

E N D
Session id: 40092 The Self-managing Database:Automatic Performance Diagnosis Graham WoodKyle Hailey Oracle Corporation
Problem Definition • Performance Diagnosis & Tuning is complex • Diagnosis often requires additional data capture • Database wide view of operations is lacking • Data overload rather than information • Misguided tuning efforts waste time & money
Problem Solution: Oracle10g • Performance Diagnosis & Tuning are complex • automated problem diagnosis • Diagnosis often requires additional data capture • complete, lightweight capture of workload data • Database wide view of operations is lacking • holistic time based analysis • Data overload rather than information • reports top problems and solutions • Misguided tuning efforts • reports non-problem areas
Oracle Database 10g– Self-Managing Database Application & SQL Management Storage Management System Resource Management Space Management Backup & Recovery Management Database Management Database Control Intelligent Infrastructure
Advisory Infrastructure Server-generated Alert Infrastructure Automatic Maintenance Task Infrastructure Automatic Workload Repository Intelligent Infrastructure • Automatic Workload Repository • “Data Warehouse” of the Database • Code instrumentation • Automatic Maintenance Tasks • Pre-packaged, resource controlled • Server-generated Alerts • Push vs. Pull, Just-in-time, Out-of-the-box • Advisory Infrastructure • Integrated, uniform Application & SQL Management Storage Management System Resource Management Space Management Backup & Recovery Management Database Management Intelligent Infrastructure
Automatic Database Diagnostic Monitor (ADDM) • Performance Diagnostic engine in the database • Automatically diagnoses performance problems • Provides Root Cause Analysis with recommended solutions • Identifies non-problems areas • Integrates all components Application & SQL Management Storage Management System Resource Management Space Management Backup & Recovery Management Database Management Intelligent Infrastructure Proactive and effective tuning
Performance Monitoring Solutions In memorystatistics SGA Snapshots Alerts ADDM Proactive Monitoring ADDM Results Workload Repository ReactiveMonitoring
Automatic Workload Repository (AWR) a.k.a. Statspack++ Server captures workload data • Every 30 minutes, or manually • Efficient capture • Self manages space requirements • Saves data for 7 days by default
Automatic Workload Repository (AWR) Classes of Data • BASE STATISTICS e.g. physical reads • SQL STATISTICSe.g. disk reads (per sql stmt) • METRICSe.g. physical reads / sec • ACTIVE SESSION HISTORY e.g. sid : 10 event : db file sequential read file# : 33, block# : 209, obj# : 19 time : 20000 μs
New Base Statistics Extensive code instrumentation Parse Conn Mgmt Java Exec • Time Model (v$sys_time_model) • Db time • Connection Management (logon, logoff) • Parse (hard, soft, failed,..) • SQL, PLSQL and Java execution times • Wait Model (v$system_event) • 700 different wait events • 12 wait classes • OS Stats (v$osstat) • CPU + Memory PLSQL Exec SQL Exec
New SQL Statistics • SQL_id – more unique hash value • SQL statement statistics • Wait class time • PLSQL time • Java time • Sampled bind values (v$sql_bind_capture) • Efficient top SQL identificationusing Δs in the kernel, by 6 dimensions: • CPU • Elapsed • Parse • ...
Active Session History (ASH) • Samples active sessions every second into memory (v$active_session_history) • Direct access to kernel structures • Selected samples flushed to AWR • Data captured includes: • SID • SQL ID • Program, Module, Action • Wait event# • Object, File, Block • actual wait time (if captured while waiting) Sampled history of v$session_wait
Performance Monitoring Solutions In memorystatistics SGA Snapshots Alerts ADDM ProactiveMonitoring ADDM Results Workload Repository ReactiveMonitoring
ADDM’s Architecture Snapshots in Automatic Workload Repository • Uses Time & Wait Model data from Workload Repository • Classification Tree is based on decades of Oracle performance tuning expertise • Time based analysis • Recommends solutions or next steps • Runs proactively & manually Automatic Diagnostic Engine Automatic Diagnostic Engine High-load SQL IO / CPU issues RAC issues SQLAdvisor System Sizing Advice Network + DB config Advice
ADDM Methodology Top down analysis of where time is spent • Period Analysis using AWR snapshots • Throughput centric • Focus on reducing time ‘DB time’ • Time based quantification • Problems with impact • Recommendations with benefit
ADDM Methodology Problem classification system Decision tree based on the Wait Model and Time Model Stats …… …… Buffer Busy RAC Waits System Wait …… Parse Latches Concurrency Buf Cache latches IO Waits Symptoms Root Causes
ADDM Methodology Problem classification system Decision tree based on the Wait Model and Time Model Stats …… …… Buffer Busy RAC Waits System Wait …… Parse Latches Concurrency Buf Cache latches IO Waits Non - Problems areas.
Top Performance Issues Not rocket science anymore
Top Performance Issues Not diagnosable using Statspack data
ADDM Output • Set of Findings with impact • Root cause • Symptoms • Non-problem areas • Recommendations with benefit and rationale • Inference Path of the analysis • Output in Advisor Framework • Externalized through EM screens or ADDM report
Before Examine system utilization Look at wait events Observe latch contention See wait on shared pool and library cache latch Review v$sysstat See “parse time elapsed” > “parse time cpu” and #hard parses greater than normal Identify SQL by.. Identifying sessions with many hard parses and trace them, or Reviewing v$sql for many statements with same hash plan Examine objects accessed and review SQL Identify “hard parse” issue by observing the SQL contains literals Enable cursor sharing Oracle10G Review ADDM recommendations ADDM recommends use of cursor_sharing Performance Diagnostic: Before and Now Scenario: Hard parse problems
Performance Monitoring Solutions In memorystatistics SGA Snapshots Alerts ADDM Proactive Monitoring ADDM Results Workload Repository Reactive Monitoring
Reactive Monitoring Overview • Reactive monitoring may still be necessary • User calls up • Real time problem diagnosis • Validate ADDM diagnosis • When an alert is raised • Uses new AWR data sources • Integrates graphical displays with ADDM • Oracle provides an integrated performance management console using all relevant data sources
Database Home Page Database Performance Page Drilldowns Session SQL EM Product Layout for Performance
Home Page Perf Page ADDM Top Session Wait Detail Top SQL ADDM Details SQL Detail Session Detail EM Pages Layout
Home Page Perf Page ADDM Top Session Wait Detail Top SQL ADDM Details SQL Detail Session Detail Two Paths
Home Page Perf Page ADDM Top Session Wait Detail Top SQL ADDM Details SQL Detail Session Detail ADDM Path
Home Page Perf Page ADDM Top Session Wait Detail Top SQL ADDM Details SQL Detail Session Detail ADDM Home
ADDM Details Home Page Perf Page ADDM Top Session Wait Detail Top SQL ADDM Details SQL Detail Session Detail
Home Page Perf Page ADDM Top Session Wait Detail Top SQL ADDM Details SQL Detail Session Detail Manual Path
Home Page Perf Page ADDM Top Session Top SQL Wait Detail ADDM Details SQL Detail Session Detail Performance Page
Home Page Perf Page ADDM Top Session Wait Detail Top SQL ADDM Details SQL Detail Session Detail Wait Drill Down