Download
1 / 22
220 likes | 355 Views
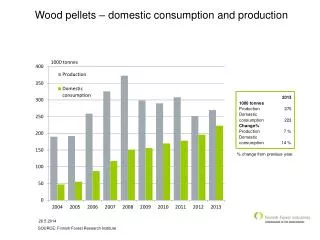
The value and challenges of micro-component domestic water consumption datasets Jo Parker. Working as part of the ESPRC - ARCC water project with the support of Anglian Water Services (AWS). Study aim.

E N D
The value and challenges of micro-component domestic water consumption datasetsJo Parker Working as part of the ESPRC - ARCC water project with the support of Anglian Water Services (AWS)
Study aim • Examine the sensitivity of long-term water demand micro-components to climate variability and change. Jo Parker
What are micro-components? Source: Ofwat
Estimating/forecasting household water demand? • Traditionally water into supply. • Complexity of household water demand. • Micro-component data provides us with the ability to investigate water use at the household scale. Jo Parker
The ‘Golden 100’ • More than 22million data points. • Too large to handle in excel. • 100 households.
Error checking algorithm • Basic error checks. • Remove large outliers percentile approach. • Stratification. • Second screening. • Apply transformation. • Regression analysis.
1. Basic error checks • Remove gross errors. • Completeness checks. • Dummy variables. • Remove 0l/d PCC.
2. Percentile approach • Remove PCC outliers (0.05% threshold determined via sensitivity testing). • e.g., one rogue entry purported 98,020 litres/day for a single occupancy household.
4. Second Screening • User defined threshold. • e.g., secondary screening (250l/d threshold) removed values such as 131218l/d in bath usage for a 3 occupancy household. • Excluding external usage.
5. Transformation • The Kolmogorov-Smirnov normality test. • Box-Cox transformation.
6. Regression – One approach doesn’t fit all Basin Bath Metered households, East region, single occupancy. Jo Parker
Bath (non-zero) Metered households, East region, single occupancy. Jo Parker
6. Regression • Analyse the frequency of usage and non-usage (Logistic regression) • Is this weather, bank holiday, day of the week etc. sensitive? • Analyse the volume used (Multiple linear regression) • Is this weather, bank holiday, day of the week etc. sensitive? Jo Parker
Basin water usage vs. Daily mean Temp. • Relatively insensitive to Mean T • What is causing striations? • Understand peak users (>40l/d)?
Bath water usage vs. Daily mean Temp. • Relatively insensitive to Mean T • What is causing striations between 20-60l/d? • Understand peak users (>80l/d)?
Dishwasher water usage vs. Daily mean Temp. Metered households • Metered • Relatively insensitive to Mean T • Understand peak users (2 uses per day)? • Unmetered • Slight negative correlation with Mean T Unmetered households
Shower water usage vs. Daily Mean Temp. • If we look at peak cluster positive correlation with Mean T.
External water usage vs. Mean Temp. Unmetered households Metered households • Non-linear sensitivity to Mean T • Where is the tipping point?
Thank you Jo Parker