Download
1 / 15
380 likes | 1.05k Views
Food Chains, Food Webs & Energy Pyramids. Francisci LS.6. Food Chain. Food Chain : Transfer of energy from one organism to the next. Food Chains use pictures, words and arrows to show the movement of energy through the trophic levels of organisms.

E N D
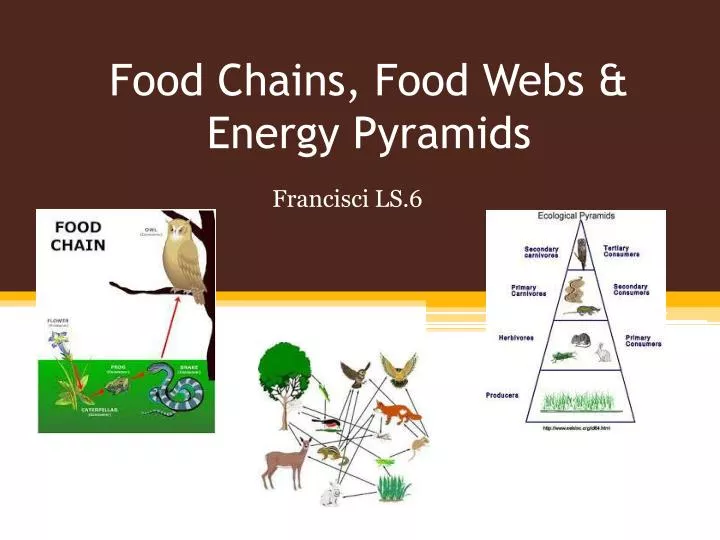
Food Chains, Food Webs & Energy Pyramids Francisci LS.6
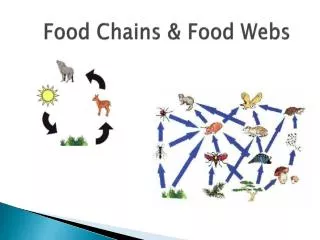
Food Chain • Food Chain: Transfer of energy from one organism to the next. • Food Chains use pictures, words and arrows to show the movement of energy through the trophic levels of organisms. • The trophic level of an organism indicates the position that the organism occupies in the food chain. • Food chains start with a producer and end with a decomposer.
Trophic Levels • Primary Producers: - Autotrophs– make their own food through photosynthesis - Examples: Plants – grass, algae, phytoplankton
Trophic Levels 2. Primary Consumers: Animals that eat primary producers (herbivores) - Examples: grasshopper, mosquito, zooplankton
Trophic Levels 3. Secondary Consumers: Eat primary consumers (carnivores & omnivores) - Examples: rat, dragonfly, fish
Trophic Levels 4. Tertiary Consumers: Eat secondary consumers (carnivores) - Examples: snake, fish, seal
Trophic Levels 5. Quaternary Consumers: Eat tertiary consumers - Top Predators: have little to no natural enemies - Examples: hawk, raccoon white shark
Trophic Levels 6. Decomposers: Breaks down dead organisms -Examples: bacteria, fungi
In this food chain, what is the producer? • What is the first level consumer? • What is the second level consumer? • Is the polar bear the • 3rd level consumer? Explain.
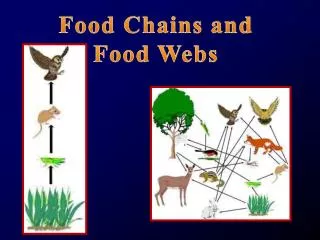
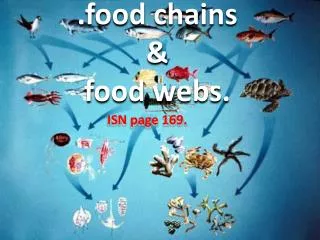
Food Web • Food Websdescribe the organisms found in interconnecting food chains using pictures or words and arrows. • In other words, food webs are a bunch of food chains all together! • They describe the complex patterns of energy flow in an ecosystem by modeling who consumes whom or what.
Energy Pyramid • An Energy Pyramid is a model that shows the amount of energy that moves from one trophic level to another in a food chain. • Bottom of the pyramid shows the producers which hold the most energy in an ecosystem. • Upper most level shows consumers and decomposers (less energy is available at each of the higher levels)