Download
1 / 29
290 likes | 438 Views
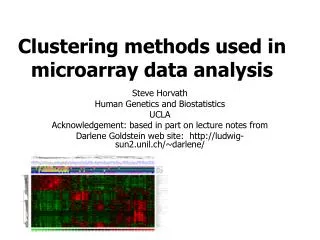
Making Sense of Complicated Microarray Data Part II Gene Clustering and Data Analysis. Gabriel Eichler Boston University Some slides adapted from: MeV documentation slides. Why Cluster?. Clustering is a process by which you can explore your data in an efficient manner.

E N D
Making Sense of Complicated Microarray DataPart II Gene Clustering and Data Analysis Gabriel Eichler Boston University Some slides adapted from: MeV documentation slides
Why Cluster? • Clustering is a process by which you can explore your data in an efficient manner. • Visualization of data can help you review the data quality. • Assumption: Guilt by association – similar gene expression patterns may indicate a biological relationship.
-2 2 Expression Vectors Gene Expression Vectors encapsulate the expression of a gene over a set of experimental conditions or sample types. 1.5 -0.8 1.8 0.5 -0.4 -1.3 1.5 0.8 Numeric Vector Line Graph Heatmap
Expression Vectors As Points in ‘Expression Space’ t 1 t 2 t 3 G1 -0.8 -0.3 -0.7 G2 -0.7 -0.8 -0.4 G3 Similar Expression -0.4 -0.6 -0.8 G4 0.9 1.2 1.3 G5 1.3 0.9 -0.6 Experiment 3 Experiment 2 Experiment 1
Distance and Similarity -the ability to calculate a distance (or similarity, it’s inverse) between two expression vectors is fundamental to clustering algorithms -distance between vectors is the basis upon which decisions are made when grouping similar patterns of expression -selection of a distance metric defines the concept of distance
Exp 1 Exp 2 Exp 3 Exp 4 Exp 5 Exp 6 x1A x2A x3A x5A Gene A x4A x6A Gene B x1B x2B x3B x4B x5B x6B 6 6 • Manhattan: i = 1 |xiA – xiB| Distance: a measure of similarity between gene expression. p1 • Some distances: (MeV provides 11 metrics) • Euclidean: i = 1(xiA - xiB)2 p0 3. Pearson correlation
Clustering Algorithms • Be weary - confounding computational artifacts are associated with all clustering algorithms. -You should always understand the basic concepts behind an algorithm before using it. • Anything will cluster! Garbage In means Garbage Out.
Hierarchical Clustering • IDEA: Iteratively combines genes into groups based on similar patterns of observed expression • By combining genes with genes OR genes with groups algorithm produces a dendrogram of the hierarchy of relationships. • Display the data as a heatmap and dendrogram • Cluster genes, samples or both (HCL-1)
Gene 1 Gene 2 Gene 3 Gene 4 Gene 5 Gene 6 Gene 7 Gene 8 Hierarchical Clustering
Gene 1 Gene 2 Gene 3 Gene 4 Gene 5 Gene 6 Gene 7 Gene 8 Hierarchical Clustering
Gene 1 Gene 2 Gene 3 Gene 4 Gene 5 Gene 6 Gene 7 Gene 8 Hierarchical Clustering
Gene 1 Gene 2 Gene 3 Gene 4 Gene 5 Gene 6 Gene 7 Gene 8 Hierarchical Clustering
Gene 1 Gene 2 Gene 3 Gene 4 Gene 5 Gene 6 Gene 7 Gene 8 Hierarchical Clustering
Gene 1 Gene 2 Gene 3 Gene 4 Gene 5 Gene 6 Gene 7 Gene 8 Hierarchical Clustering
Gene 1 Gene 2 Gene 3 Gene 4 Gene 5 Gene 6 Gene 7 Gene 8 Hierarchical Clustering
Gene 1 Gene 2 Gene 3 Gene 4 Gene 5 Gene 6 Gene 7 Gene 8 Hierarchical Clustering
Hierarchical Clustering Samples Genes The Leaf Ordering Problem: • Find ‘optimal’ layout of branches for a given dendrogram • architecture • 2N-1 possible orderings of the branches • For a small microarray dataset of 500 genes • there are 1.6*E150 branch configurations
Hierarchical Clustering The Leaf Ordering Problem:
Hierarchical Clustering • Pros: • Commonly used algorithm • Simple and quick to calculate • Cons: • Real genes probably do not have a hierarchical organization
Self-Organizing Maps (SOMs) A Idea: Place genes onto a grid so that genes with similar patterns of expression are placed on nearby squares. B C D c a d b
Self-Organizing Maps (SOMs) A IDEA: Place genes onto a grid so that genes with similar patterns of expression are placed on nearby squares. B C D c a d b
The Gene Expression Dynamics Inspector – GEDI S a m p l e s } } } Group C Group A Group B C1 C2 C3 C4 B2 B1 B3 B4 A1 A2 A3 A4 Gene 1 G en e s Gene 2 G en e s Gene 3 Gene 4 Gene 5 Gene 6 Group C Group A Group B … • GEDI’s Features: • Allows for simultaneous analysis or several time courses or datasets • Displays the data in an intuitive and comparable mathematically driven visualization • The same genes maps to the same tiles H Group A Group B Group C L 1 2 3 4
Software Demonstrations MeV available at http://www.tigr.org/software/tm4/mev.html GEDI available at http://www.chip.org/~ge/gedihome.htm
G.E.D.I. allows the direct visual assessment of the quality of conventional cluster analysis Comparison of GEDI vs. Hierarchical ClusteringHierarchical clustering of random data(GIGO) From: CreateGEP_Journal.wpd, random_A