Download
1 / 1
10 likes | 96 Views
200. 150. y-counts. 100. 80. 50. 0. 60. -3. -2. -1. 0. 1. 2. 3. y-counts. 40. x-value. 20. 0. -1.0. -0.5. 0.0. 0.5. 1.0. x-value. Service-Oriented Local And Global Visualization with Sorting On-demand for Climate Data. Zhe Zhang zzhang13@ncsu.edu. Ye Jin

E N D
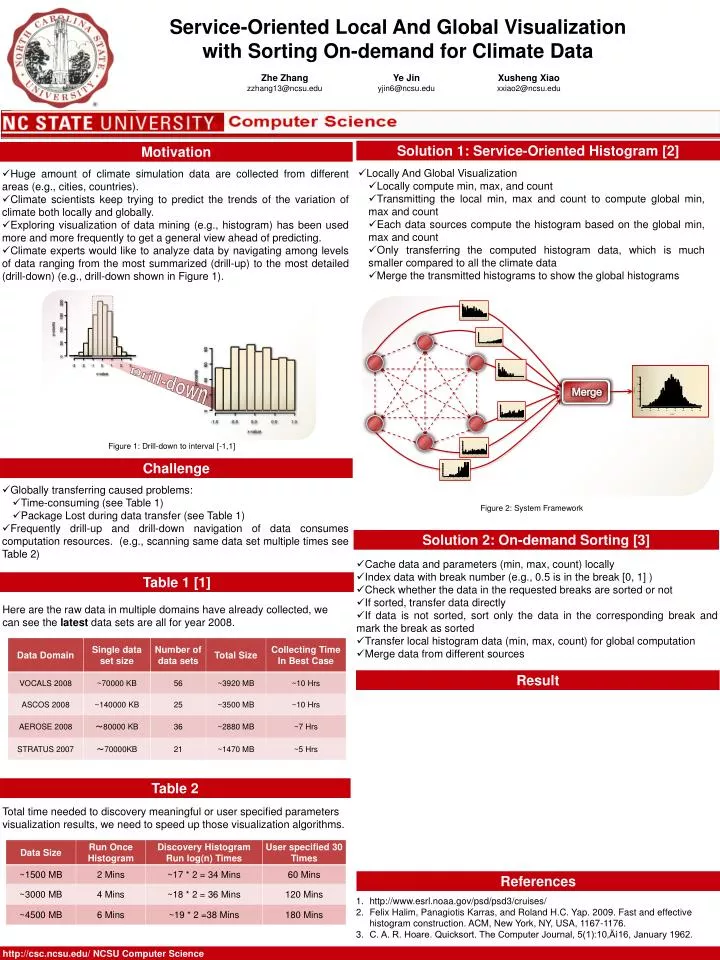
200 150 y-counts 100 80 50 0 60 -3 -2 -1 0 1 2 3 y-counts 40 x-value 20 0 -1.0 -0.5 0.0 0.5 1.0 x-value Service-Oriented Local And Global Visualization with Sorting On-demand for Climate Data Zhe Zhang zzhang13@ncsu.edu Ye Jin yjin6@ncsu.edu Xusheng Xiao xxiao2@ncsu.edu Solution 1: Service-Oriented Histogram [2] Motivation • Locally And Global Visualization • Locally compute min, max, and count • Transmitting the local min, max and count to compute global min, max and count • Each data sources compute the histogram based on the global min, max and count • Only transferring the computed histogram data, which is much smaller compared to all the climate data • Merge the transmitted histograms to show the global histograms • Huge amount of climate simulation data are collected from different areas (e.g., cities, countries). • Climate scientists keep trying to predict the trends of the variation of climate both locally and globally. • Exploring visualization of data mining (e.g., histogram) has been used more and more frequently to get a general view ahead of predicting. • Climate experts would like to analyze data by navigating among levels of data ranging from the most summarized (drill-up) to the most detailed (drill-down) (e.g., drill-down shown in Figure 1). Drill-down Figure 1: Drill-down to interval [-1,1] Merge Challenge • Globally transferring caused problems: • Time-consuming (see Table 1) • Package Lost during data transfer (see Table 1) • Frequently drill-up and drill-down navigation of data consumes computation resources. (e.g., scanning same data set multiple times see Table 2) Figure 2: System Framework Solution 2: On-demand Sorting [3] • Cache data and parameters (min, max, count) locally • Index data with break number (e.g., 0.5 is in the break [0, 1] ) • Check whether the data in the requested breaks are sorted or not • If sorted, transfer data directly • If data is not sorted, sort only the data in the corresponding break and mark the break as sorted • Transfer local histogram data (min, max, count) for global computation • Merge data from different sources Table 1 [1] Here are the raw data in multiple domains have already collected, we can see the latest data sets are all for year 2008. Result Table 2 Total time needed to discovery meaningful or user specified parameters visualization results, we need to speed up those visualization algorithms. References • http://www.esrl.noaa.gov/psd/psd3/cruises/ • Felix Halim, Panagiotis Karras, and Roland H.C. Yap. 2009. Fast and effective histogram construction. ACM, New York, NY, USA, 1167-1176. • C. A. R. Hoare. Quicksort. The Computer Journal, 5(1):10‚Äì16, January 1962. http://csc.ncsu.edu/ NCSU Computer Science