Download

1 / 42
460 likes | 536 Views
Learn complex raster modeling with Map Algebra, managing rasters, and optimization techniques in Python for efficient spatial analysis. Access advanced spatial tools and execute complex expressions easily.

E N D
July 2012 Python - Raster Analysis Kevin M. Johnston Ryan DeBruyn
The problem that is being addressed • You have a complex modeling problem • You are mainly working with rasters • Some of the spatial manipulations that you trying to implement are difficult or not possible using standard ArcGIS tools • Due to the complexity of the modeling problem, processing speed is a concern
Outline • Managing rasters with management tools and performing analysis with Map Algebra • How to access the analysis capability – Demonstration • Complex expressions and optimization – Demonstration • Additional modeling capability: classes – Demonstration • Full modeling control: NumPy arrays – Demonstration • Pre-10 Map Algebra
The complex model Emerald Ash Borer Originated in Michigan Infest ash trees 100% kill Coming to Vermont
The ash borer model • Movement by flight • 20 km per year • Vegetation type and ash density (suitability surface) • Movement by hitchhiking • Roads • Camp sites • Mills • Population • Current location of the borer (suitability surface) • Random movement
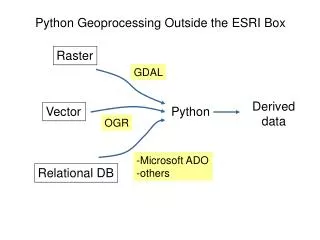
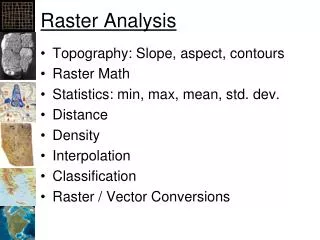
Raster analysis • To prepare and manage raster data • Displaying • Adding, copying, deleting, etc. • Mosaic, Clip, etc. • Raster object • NumPy, ApplyEnvironment, etc. • To perform the analysis use raster analysis/modeling • Spatial Analyst • Map Algebra
What is Map Algebra • Simple and powerful algebra to execute Spatial Analyst tools, operators, and functions to perform geographic analysis • The strength is in creating complex expressions • Available through Spatial Analyst module • Integrated in Python (all modules available)
Importing Spatial Analyst • Module of ArcPy site package • Like all modules must be imported • To access the operators and tools in an algebraic format the imports are important import arcpy from arcpy import env # Analysis environment from arcpy.sa import *
General syntax • Map Algebra available through an algebraic format • Simplest form: output raster is specified to the left of an equal sign and the tool and its parameters on the right • Comprised of: • Input data • Operators • Tools • Parameters • Output from arcpy.sa import * outRas = Slope(“indem”)
Input data • Input elements • Rasters • Features • Numbers • Constants • Objects • Variables outRas = Slope(“inraster”) Tip: Names are quoted – if in workspace no path is necessary (or if using Python window and the layer is in the TOC)
Map Algebra operators • Symbols for mathematical operations • Many operators in both Python and Spatial Analyst • Cast the raster (Raster class constructor) indicates operator should be applied to rasters outRas = Raster(“inraster1”) + Raster(“inraster2”) outRas2 = Raster(“inraster”) + 8
Map Algebra tools • All the tools that output a raster are available (e.g., Sin, Slope, Reclassify, etc.) • Can use any Geoprocessing tools outRas = Aspect(“inraster”) Tip: Tool names are case sensitive
Tool parameters • Defines how the tool is to be executed • Each tool has its own unique set of parameters • Some are required, others are optional • Numbers, strings, and objects (classes) outRas = Slope(“inraster”, “PERCENT_RISE”) Tip: Keywords are in quotes and it is recommended they are capitalized
Map Algebra output • Stores the results as a Raster object • Object with methods and properties • Generally, in Python window and scripting the output is temporary outRas = Hillshade(“inraster”)
Access to Map Algebra • Raster Calculator • Spatial Analyst tool • Easy to use calculator interface • Stand alone or in ModelBuilder • Python window • Single expression or simple exploratory models • Scripting • Complex models • Line completion and colors
Demo 1: Data management Raster management tools Raster Calculator Python window ModelBuilder Simple expressions
Outline • Managing rasters with management tools and performing analysis with Map Algebra • How to access the analysis capability - Demonstration • Complex expressions and optimization - Demonstration • Additional modeling capability: classes - Demonstration • Full modeling control: NumPy arrays - Demonstration • Pre-10 Map Algebra
Complex expressions • Multiple operators and tools can be implemented in a single expression • Output from one expression can be the input to a subsequent expression Tip: It is a good practice to set the input to a variable and use the variable in the expression
More on the raster object • A variable with a pointer to a dataset • Output from a Map Algebra expression or from an existing dataset • The associated dataset is temporary (when created from Map Algebra) but has a save method • A series of properties describing the associated dataset • Description of raster (e.g., number of rows) • Description of the values (e.g., mean)
Optimization • A series of local tools (Abs, Sin, Cell Statistics, etc.) and operators can be optimized • Work on a per-cell basis • When entered into a single expression each tool and operator is processed on a per cell basis
The iterative aspects of the ash borer model • Movement by flight • Depends on the year how far it can move in a time step • “Is there a borer in my neighborhood” • “Will I accept it” – suitability surface • Movement by hitchhiking • Based on highly susceptible areas • Nonlinear decay • Random points and check susceptibility • Random movement • Nonlinear decay from known locations (NumPy array)
Demo 2: Movement by hitchhiking Roads, Campsites, Mills, Population,and current location (suitability) Complex expressions Raster object Optimization
Outline • Managing rasters with management tools and performing analysis with Map Algebra • How to access the analysis capability - Demonstration • Complex expressions and optimization - Demonstration • Additional modeling capability: classes - Demonstration • Full modeling control: NumPy arrays - Demonstration • Pre-10 Map Algebra
Classes • Objects that are used as parameters to tools • Varying number of arguments depending on the selected parameter choice (neighborhood type) • The number of entries into the parameters can vary depending on the specific situation (a remap table) • More flexible • Query the individual arguments
Classes - Categories • General • Fuzzy classes - Time classes • Hf classes - VF classes • KrigingModel classes - Radius classes • Nbr classes • Composed of lists • Topo classes • Composed of lists within lists • Reclass - Weighted reclass tables • Topo classes (a subset)
Classes - Categories • Creating • Querying • Changing arguments neigh = NbrCircle(4, “MAP”) radius = neigh.radius neigh.radius = 6
Vector integration • Feature data is required for some Spatial Analyst Map Algebra • IDW, Kriging, etc. • Geoprocessing tools that operate on feature data can be used in an expression • Buffer, Select, etc.
The iterative aspects of the ash borer model • Movement by flight • Depends on the year how far it can move in a time step • “Is there a borer in my neighborhood” • “Will I accept it” – suitability surface • Movement by hitchhiking • Based on highly susceptible areas • Nonlinear decay • Random points and check susceptibility • Random movement • Nonlinear decay from known locations (NumPy array)
Demo 3: Movement by flight 20 km per year Vegetation type/ash density (suitability) Classes Using variables Vector integration
Outline • Managing rasters with management tools and performing analysis with Map Algebra • How to access the analysis capability - Demonstration • Complex expressions and optimization - Demonstration • Additional modeling capability: classes - Demonstration • Full modeling control: NumPy arrays - Demonstration • Pre-10 Map Algebra
NumPy Arrays • A generic Python storage mechanism • Create custom tool • Access the wealth of free tools built by the scientific community • Clustering • Filtering • Linear algebra • Optimization • Fourier transformation • Morphology
NumPy Arrays • Two tools • RasterToNumPyArray • NumPyArrayToRaster Raster Numpy Array 1 3 3 1 3 3 2 4 4 2 4 4
The iterative aspects of the ash borer model • Movement by flight • Depends on the year how far it can move in a time step • “Is there a borer in my neighborhood” • “Will I accept it” – suitability surface • Movement by hitchhiking • Based on highly susceptible areas • Nonlinear decay • Random points and check susceptibility • Random movement • Nonlinear decay from known locations (NumPy array)
Demo 4: The random movement Random movement based on nonlinear decay from existing locations Custom function NumPy array
Outline • Managing rasters with management tools and performing analysis with Map Algebra • How to access the analysis capability - Demonstration • Complex expressions and optimization - Demonstration • Additional modeling capability: classes - Demonstration • Full modeling control: NumPy arrays - Demonstration • Pre-10 Map Algebra
Pre-10.0 Map Algebra • Similar to Map Algebra 10.0 • Faster, more powerful, and easy to use (line completion, colors) • Any changes are to take advantage of the Python integration • Raster Calculator at 10.0 replaces the Raster Calculator from the tool bar, SOMA, and MOMA • SOMA in existing models will still work
Summary • When the problem become more complex you may need additional capability provided by Map Algebra • Map Algebra powerful, flexible, easy to use, and integrated into Python • Accessed through: Raster Calculator, Python window, ModelBuilder (through Raster Calculator), and scripting • Raster object and classes • Create models that can better capture interaction of phenomena
ArcGIS Spatial Analyst Technical Sessions • An Introduction - Rm 15B Tuesday, July 24, 8:30AM – 9:45AM Wed, July 25, 1:30PM – 2:45PM • Suitability Modeling - Rm 15A Tuesday, July 24, 10:15AM – 11:30AM Thursday, July 26, 3:15PM – 4:30PM • Raster Analysis with Python – Ball06 E Tuesday, July 23, 3:15PM – 4:30PM Thursday, July 25, 3:15PM – 4:30PM • Creating Surfaces – Rm 15A Wednesday, July 25, 8:30PM – 9:45PM
ArcGIS Spatial Analyst Short Technical Sessions • Creating Watersheds and Stream Networks – Rm 01B Tuesday, July 24, 1:30 PM – 1:50PM • Performing Regression Analysis Using Raster Data – 01A Tuesday, July 24, 9:20AM – 9:40AM
Demo Theater Presentations – Exhibit Hall C • Modeling Rooftop Solar Energy Potential Tuesday, July 24, 11:30AM – 12:00PM • Surface Interpolation in ArcGIS Wednesday, July 25, 1:00PM – 2:00PM • Getting Started with Map Algebra Thursday, July 26, 10:00AM – 11:00AM • Agent-Based Modeling Wednesday, July 25, 12:00PM – 1:00PM
Thank You!...Open to QuestionsPlease fill the evaluations.www.esri.com/ucsessionsurveysFirst Offering ID: XXXX Second Offering ID: XXXX My UC Homepage > “Evaluate Sessions”