Download
1 / 19
190 likes | 509 Views
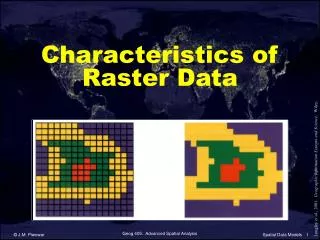
Raster Data Analysis. Chapter 11. Introduction. Regular grid Value in each cell corresponds to characteristic Operations on individual, group, or grid ArcView with Spatial Analyst Extension ARC/INFO GRID. Data Analysis Environment. Extent and cell size Extent x-y min/max

E N D
Raster Data Analysis Chapter 11
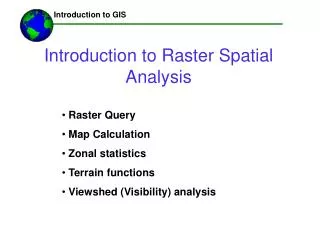
Introduction • Regular grid • Value in each cell corresponds to characteristic • Operations on individual, group, or grid • ArcView with Spatial Analyst Extension • ARC/INFO GRID
Data Analysis Environment • Extent and cell size • Extent • x-y min/max • or combination (union or intersect of two grids) • Mask grid • limits analysis to cells that do not carry “No Data” value • remember zero is different from “no data” • Accuracy to least
Local Operations • Cell by cell operations creating a new grid from either a single input grid or multiple input grids manipulated by a function. • Single grid • output as mathematical function such as • arithmetic (+, -, *, /, abs, int, floating) • logarithmic (exponentials, logarithms) • trigonometric (sin, cos, tan, arcsin, arccos, arctan) • power (square, square root, power) • radians
Local Operations • Multiple grids (compositing, overlaying, or superimposing) • More frequent to have multiple • Summary statistics (max, min, range, sum, mean, median, standard deviation) • Categorical statistics (majority, minority, unique values)
Local Operations • In ArcView Cell Statistics or Map Calculator • Map Calculator uses Avenue • [object].request(paramter) format • large assortment of arithmetic, logical, Boolean, logarithmic, trigonometric and power functions
Applications of Local Operations • Universal Soil Loss • A = R K L S C P • A = average soil loss in tons • R = rainfall intensity • K = erodibility of the soil • L = slope length • S = slope gradient • C = cultivation factor • P = supporting practice factor
Neighborhood Operations • Focus cell and surrounding cells • F+4 and F+8 most common • Circule, annulus, wedge • Focus Cellcomputationback to Focus Cell • Similar to what happens with grid1+grid2=grid3 • Summary statistics available
Neighborhood Operations • Neighborhood operations in ArcView • Neighborhood Statistics using grid or point • Statistic and neighborhood • Statistic (min, max, mean, median, sum, range, standard deviation, majority, minority, and variety) • Neighborhood (rectangle, circle, doughnut, and wedge) • Block Stats (not cell to cell but block to block)
Neighborhood Operations • Applications of Neighborhood Operating • Data simplification using moving average with average of neighborhood being assigned to the focus cell • Variation by using variety in the focus cell • Filtering, convolution, moving window operations • Edge enhancement (range to focus) • Smoothing (majority to focus)
Zonal Operations • Zonal operation works with groups of cells of same values or like features called zones • Describe the geometry of zones such as area, perimeter thickness and centroid • Can be one grid or input + zonal = output
Zonal Operations • Zonal operations in ArcView • Map Calculator can calculate geometry of zones in an input grid • Summarize Zones, Histogram by Zone and Tabulate Areas for two grids
Applications of Zonal Operations • Landscape ecology (ie shape index) • Comparison grids
Distance Measure • Distance measure operations calculate distances away from cells designated as the source cells. • 1 cell lateral, 1.4142 cells for diagonal link • Physical distance vs cost distance • Can be coded in direction units
Physical Distance Measure Operations • Cell units for measurements • Buffer source cells
Cost Distance Measure Operations • Cell + cost cell in second grid • Impedance as defined by the application • Average of cells in link used for calculation • Least cost path is objective
Distance Measure Operations in ArcView • Assign proximity • CostDistance • CostPath
Applications of Distance Measure Operations • Modeling • Buffering not as accurate as vector
Spatial Autocorrelation • Spatial autocorrelation measures the relationship among values of a variable according to the spatial arrangement of the values. • High correlation if like values are closely packed • Moran’s I • Geary’s C