Download
1 / 15
150 likes | 169 Views
Explore enrollment demographics, suspensions, attendance, ELA & Math passing rates, absenteeism trends, and student growth levels in this comprehensive report from the 2017-18 school year.

E N D
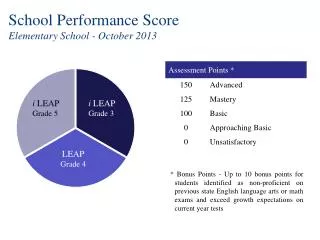
Arthur Rann Elementary School Performance Report Data from the 2017-18 School Year
ELA Passing Percentage Over 3 Years 6thGrade 17-18 6thGrade 17-18 5thGrade 17-18 4thGrade 17-18 5thGrade 17-18 5thGrade 17-18 4thGrade 17-18 6thGrade 17-18
Math Passing Percentage Over 3 Years 5thGrade 17-18 5thGrade 17-18 4thGrade 17-18 6thGrade 17-18 6thGrade 17-18 4thGrade 17-18 6thGrade 17-18 5thGrade 17-18
ELA 17-18 Passing Percentage Compared to District/DFG/County
Math 17-18 Passing Percentage Compared to District/DFG/County