Download
1 / 25
250 likes | 378 Views
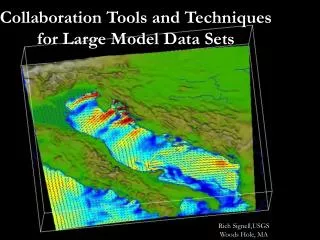
Desktop Techniques for the Exploration of Terascale Sized Turbulence Data Sets. John Clyne Scientific Computing Division National Center for Atmospheric Research Boulder, CO USA.

E N D
Desktop Techniques for the Exploration of Terascale Sized Turbulence Data Sets John Clyne Scientific Computing Division National Center for Atmospheric Research Boulder, CO USA clyne@ncar.ucar.edu
[Numerical] models that can currently be run on typical supercomputing platforms produce data in amounts that make storage expensive, movement cumbersome, visualization difficult, and detailed analysis impossible. The result is a significantly reduced scientific return from the nation's largest computational efforts. We can now compute more data than we know how to analyze!!! clyne@ncar.ucar.edu
A sampling of various technology performance curves • Not all technologies advance at same rate!!! clyne@ncar.ucar.edu
Growth of individual NCAR simulation data sets Representative data sets from climate, turbulence, and weather disciplines clyne@ncar.ucar.edu
Climate simulation grid resolutions clyne@ncar.ucar.edu
504x504x2048 5 variables (u,v,w,rho,temp) ~500 time steps saved 9TBs storage (4GBs/variable/timestep) Six months compute time required on 112 IBM SP RS/6000 processors Three months for post-processing Data may be analyzed for several years Example: Compressible plume dynamics M. Rast, 2004. Images courtesy of Joseph Mendoza, NCAR/SCD clyne@ncar.ucar.edu
Batch & Interactive Batch Interactive Bandwidth requirements? Bandwidth requirements? Workflow in computational science Simulation Post Processing Analysis & Visualization Storage Storage clyne@ncar.ucar.edu
What is meant by interactive computing? Definition: A system is interactive if the time between a user event and the response to that event is short enough maintain my full attention If the response time is… 1-5 seconds : I’m engaged 5-60 seconds : I’m reading email 1-3 minutes : I’ve forgotten what I was trying to do > 3 minutes : I’ve given up! clyne@ncar.ucar.edu
Assumptions Single precision 100 MB/sec bandwidth No contention Interactive! Reading mail!! IO wait times for high resolution simulations clyne@ncar.ucar.edu
Visualization and Analysis Platform for oceanic, atmospheric, and solar Research (VAPoR) Key components • Domain specific application focus: numerically simulated turbulence • Quantitative capabilities to support scientific data analysis • Integrate visualization into analysis process, interactively steering the analysis while enhancing data understanding • Employ multiresolution data representation as a data reduction technique Combination of visualization with multiresolution data representation that provide sufficient data reduction to enable interactive work This work is funded in part through a U.S. National Science Foundation, Information Technology Research program grant clyne@ncar.ucar.edu
1/8 1/4 1/2 • Multiple copies of data at varying power of two resolutions • Storage costs: Enabling speed/quality tradeoffs with multiresolution data representation • 2D Example: Texture MIP Mapping 1 clyne@ncar.ucar.edu
Permit hierarchical data representation Invertible and lossless (subject to floating point round off errors) Numerically efficient – forward and inverse transform No additional storage cost!!! Wavelet Transforms for 3D Multiresolution data representation clyne@ncar.ucar.edu
Compressible Convection M. Rast, 2002 1283 5123 clyne@ncar.ucar.edu
Compressible plume Compressible plume data set shown at native and progressively coarser resolutions Resolution: Problem size: 504x504x2048 Full 252x252x1024 1/8 126x126x512 1/64 63x63x256 1/512 clyne@ncar.ucar.edu
Interactive Rendering timings 5123 Compressible Convection 5042x2048 Compressible Plume SGI Octane2, 1x600MHz R14k SGI Origin, 10x600MHz R14k Reduced resolution affords responsive interaction while preserving all but finest features clyne@ncar.ucar.edu
p: pressure : density T: temperature : ionization potential : Avogadro’s number me: electron mass k: Boltzmann’s constant h: Planck’s constant Derived quantities Derived quantities produced from the simulation’s field variables as a post-process clyne@ncar.ucar.edu
Calculation timings for derived quantities SGI Origin, 10x600MHz R14k Note: 1/2th resolution is 1/8th problem size, etc Deriving new quantities on interactive time scales only possible with data reduction clyne@ncar.ucar.edu
Full domain seen from above. Full domain seen from above. Subdomain from side. Subdomain from side. Integrated visualization and analysis on interactively selected subdomains: Mach number of the vertical velocity. Efficient analysis requires rapid calculation and visualization of unanticipated derived quantities. This can be facilitated by a combination of subdomain selection and resolution reduction. Vertical vorticity of the flow.
A test of multiresolution analysis: Force balance in supersonic downflows Resolution Full Half Subdomain selection and reduced resolution together yield data reduction by a factor of 128!!! Sites of supersonic downflow are also those of very high vertical vorticity. The cores of the vortex tubes are evacuated, with centripetal acceleration balancing that due to the inward directed pressure gradient. Buoyancy forces are maximum on the tube periphery due to mass flux convergence. The same interpretation results from analysis at half resolution.
Future??? Original 20:1 Lossy Compression clyne@ncar.ucar.edu
Live VAPOR demonstrations, SGI Theatre (booth # 602): • Wednesday, 11:30am • Thursday, 3:30pm • VAPOR URL: • http://www.scd.ucar.edu/hss/dasg/software/vapor Questions??? clyne@ncar.ucar.edu
Inadequate IO bandwidth is but one impediment to interactive analysis and visualization. • Others impediments include: • Insufficient capacity of high-speed storage • Reliance on un-optimized, serial applications • Mismatch between simulation and analysis computing resources clyne@ncar.ucar.edu
NCAR Science More than just the atmosphere… from the earth’s oceans to the solar interior Turbulence The Sun Space Weather Atmospheric Chemistry Climate Weather clyne@ncar.ucar.edu