Download
1 / 40
400 likes | 511 Views
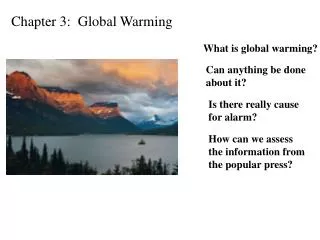
Global Warming Lecture 3. A departure from previous years approach. This lecture will provide a case FOR anthropogenic global warming The next will provide a case AGAINST anthropogenic global warming You job is to decide which elements you believe, and importantly WHY?

E N D
Global WarmingLecture 3 • A departure from previous years approach. • This lecture will provide a case FOR anthropogenic global warming • The next will provide a case AGAINST anthropogenic global warming • You job is to decide which elements you believe, and importantly WHY? • It is not the case that one lecture is “correct” and the other “wrong”. • As these lectures are supposed to represent what you might see at a research conference, I will not write notes on the board.
Outline • A link between radiative forcing and temperature • Human induced forcing through greenhouse gases is real • Feedbacks amplify (not damp) the effects • The temperature of the earth is rising
Evidence for Milankovitch theory (wikipedia!)
Global warming potentials (GWP): The ratio of the radiative forcing produced over a timescale of 100 years for 1kg of greenhouse gas, relative to 1kg of carbon dioxide. Houghton (2009)
Figure TS.5 Anthropogenic Radiative Forcings IPCC AR4 2007
Figure TS.5 Radiative Forcings IPCC AR4 2007
Rise of global Greenhouse gases with industrial era • (IPCC S/PM 2001) • CO2 emissions continue to accelerate (IPCC 2007) G/house gas and aerosol buildup
(b) Sulphate aerosols deposited in Greenland ice • Industrial sulphate aerosols appear to have peaked for Greenland record.
Response and Feedback Add in some feedback f defined as Feedback can either amplify, or damp the impact of changes in forcing Positive feedback has positive f, negative feedback has negative f. Stability limit f<1 (some would claim this is exceeded).
Water vapour feedback Water saturation (mid troposphere) <-Simulation Observed->
Cloud Radiation Feedback Potentially quite large Altitude dependent Net highly uncertain
Ocean Circulation Feedback • Huge heat capacity • - delays warming • Circulation driven by: • temperature difference • salinity difference • rotation of earth • redistributes regionally:more winter heat to NW Europe from ocean transport than from sun • global heat redistribution still dominated by atmosphere
Feedback means that global temperature rises are twice what is expected for simple models
coupled Ocean-Atmosphere General/Global Circulation Models ~100km horizontal res’n; Finer (~2) for ocean than atmosphere. ~20 layers atmosphere; ~20 layers ocean. Geography inevitably coarse. “Regionalisation”: redo simulation of one region only (e.g. Europe) matched onto cruder global simulation
Features and processes Moist processes: Evaporation & condensation: clouds and latent heat Radiation processes, light and IR Sub-resolution convection -> effective viscosity & dispersion Surface changes, e.g. of albedo and roughness Atmosphere-Surface exchange: heat, vapour, liquid, momentum
<<10km: three dimensional >>10km: two dimensional Turbulence Sub-resolution convection -> effective viscosity & dispersion
Climate Weather
Major Volcanos State of art ca 2000 -> Major volcanic eruptions are a visible and predictable perturbation on the climate.
Figure TS.23 “Greenhouse gas forcing has very likely [90%] caused most of the observed global warming over the last 50 years.” IPCC 2007 IPC 2007 ….likely [67%].. IPCC 2001
IPCC 2007 Previous predictions … correct to show wide error bars
Predictability General claim: Weather chaotic (beyond ~two weeks) but wider/longer scale climate changes relatively predicable. Evidence: Correlation of ice ages with Milankovitch cycles (of earth orbit) Successful replication of response to largest sudden terrestrial perturbations: Volcanoes El Nino changes in ocean circulation Replication of 20th climate trends Exploit: Expensive OAGCM calculations -> calibrate simpler climate simulations -> mass produce climate predictions for different future scenarios
SpecialReport on Emissions Scenarios B2 • Population peaks mid century. • A1: technology-led economy, • F fossil fuels vs ( B “balanced” ) vs T non-fossil fuelled. B1: info & service economy; sustainability & global sol’ns. • Population continues to increase. • A2: very heterogeneous world (“business as usual”) • B2: lower growth rate; emphasis on local solutions not predictions, but a range of plausible assumptions
The global climate of the 21st century IPCC S/PM 2001
Figure TS.28 IPCC 2007: Scenario -> OAGCM -> Climate prediction
Figure 10.4 IPCC 2007
Observed and projected changes in extreme weather and climate events. IPCC S/PM 2001
OAGCM predictions (sample) annual mean change of the temperature (colour shading) and its range (isolines) (Unit: °C) for SRES A2 and B2 . period 2071 to 2100 relative to 1961 to 1990 B2 IPCC2001