Download

1 / 42
430 likes | 896 Views
Comparison of Switchover Methods for Injection Molding. David O. Kazmer, Sugany Velusamy, Sarah Westerdale, and Stephen Johnston Plastics Engineering Department University of Massachusetts, Lowell Priamus Users Group Meeting September 30 th , 2008. Agenda. Motivation

E N D
Comparison of Switchover Methods for Injection Molding David O. Kazmer, Sugany Velusamy, Sarah Westerdale, and Stephen Johnston Plastics Engineering Department University of Massachusetts, Lowell Priamus Users Group Meeting September 30th, 2008
Agenda • Motivation • Manufacturing competitiveness • Characteristics of highly productive molders • Switchover Methods • Overview • Experimental Setup • Results • Conclusions
U.S. Manufacturing Productivity Where is it going tocome from? • Manufacturers need 1.5% annual productivity gains to remain competitive
Characteristics of Highly Competitive Molders • Highly systematized • Excellent layout • Consistent and often uni-directional flow of materials • Uniform internal planning processes • Uniform quality control processes. • Many highly productive facilities use only one primary supplier of plastics machinery.
Characteristics of Highly Competitive Molders • Highly utilized • 24 x 7 operation • 90% plus machine utilization • Steady state strategy • Use fewer and better machines running continuously rather than more machines running fewer shifts
Characteristics of Highly Competitive Molders • High yields • 95% typical • 99.8% not necessary • High quality assurance • Automatic: in-mold systems, vision, poka-yoke • Conservative rules to contain defects • Better to automatically reject 10 good parts than accept one bad part
Characteristics of Highly Competitive Molders • Industry sector andapplication focus • Connectors • Gears • Syringes • Focus provides • Advanced application-specific knowledge • Market commitment and technology investment
Obsolete vs. Competitive • Number of machines Obsolete Competitive
Obsolete vs. Competitive • Number of workers Obsolete Competitive
Obsolete vs. Competitive • Number of supervisors Obsolete Competitive
Obsolete vs. Competitive • Plant size Obsolete Competitive
Obsolete vs. Competitive • Energy usage Obsolete Competitive
U.S. Manufacturing Productivity • Manufacturers need 1.5% annual productivity gains to remain competitive
Agenda Motivation Manufacturing competitiveness Attributes of highly productive molders Switchover Methods Overview Experimental Setup Results Conclusions
Overview: Switchover Concept Switchover is the point at which the filling phase ends and packing phase starts From a controls perspective, there is a switch in the system’s boundary conditions and stiffness Variances cause: Dimensional errors Part weightvariations Back flow Pressure Velocity Switchover time time
Overview:Switchover Methods Various methods for switchover: Screw Position* Injection Time Injection Pressure Cavity Pressure Cavity Temperature Nozzle Pressure Tie Bar Deflection Other studies have been conducted. This study is more comprehensive with respect to number of methods and also long term variation. Filling Stage Packing Stage
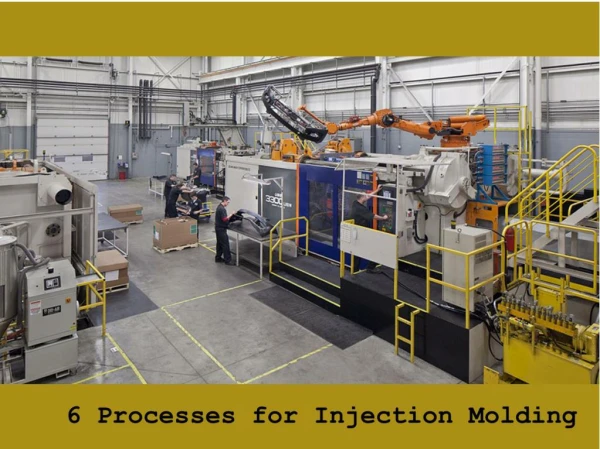
Experimental Setup • Molding Machine • 50 metric ton All Electric Machine • Make: Ferromatik Milacron • Model: Electra 50 Evolution • Plastic Material: • AMOCO Polypropylene • Grade 10-3434
Process Monitoring & Control • Extremely well instrumented machine & mold • Screw position transducer • Nozzle pressure transducer • Ram load transducer • 3 barrel thermocouples • 4 in-mold pressure transducers • 2 in-mold temperature sensors • Nozzle infrared pyrometer • In-mold infrared pyrometer • PRIAMUS DAQ8102 acquisition • Custom machine override circuit • Internal or external voltage signal triggers the machine for switchover
Seven Switchover Methods Machine Controlled Screw Position Injection Pressure Injection Time Externally Controlled Nozzle pressure Runner Pressure Tensile Cavity Pressure Cavity Temperature Six Measured Attributes Impact Thickness (mm) Impact Weight (g) Impact Width (mm) Tensile Thickness (mm) Tensile Weight (g) Tensile Width (mm) Switchover Methods & Measured Attributes
Single Cycle: Screw Position, Nozzle Pressure, & Cavity Pressure
100 consecutive molding cycles were monitored & data acquired The average & standard deviation was calculated to measure of short term variation Molding Machine Statistical Characterization
Switchover values for each method were determined to provide same part weight Switchover Settings
DOE performed to impose long term variation Design of Experiments (DOE)
Analysis • The 90 cycle DOE was repeated for each of the seven switchover conditions • Parts weighed & dimensions measured • The data was analyzed in Matlab to provide: • Individual traces for each of 630 cycles • Overlaid traces for all cycles in a DOE run • Overlaid traces for all cycles in a switchover method • Regression coefficients & main effects plots
90 Cycles across the DOE for Ram Position (Conventional) Switchover Position Switchover
Main Effects on Impact Thicknessfor Ram Position Switchover Good process robustness
90 Cycles across the DOE for Filling Time Switchover Time Switchover
Main Effects on Impact Thicknessfor Filling Time Switchover Very poor process robustness
90 Cycles across the DOE for Cavity Pressure Switchover Pressure Switchover
Main Effects on Impact Thicknessfor Cavity Pressure Switchover Good process robustness
90 Cycles across the DOE for Cavity Temperature Switchover Temperature Switchover
Main Effects on Impact Thickness Cavity Temperature Switchover Best process robustness
Coefficient of Variation COV = σ / µ Different switchovers are best for different attributes
Switchover Performance:Short vs. Long Run Variation Short Run Variation (%) More robust Long Run Variation (%)
Switchover Performance:Long-Run Variation Screw position Injection time Machine pressure Nozzle pressure Runner pressure Cavity pressure Cavity temperature
Conclusions Cavity temperature provided the most robustness against changes the process settings. Place the sensor near but not at the very end of flow due to small control system delays (speed matters) Cavity pressure provided reasonable switchover control but had susceptibility to changes in melt temperature and velocity. Position control provided reasonable control but roughly twice the variation of cavity temperature. Injection time is the least reproducible method for the transfer from fill to pack, with literally 10 times the variation of temperature control.
Conclusions • Measured consistency is much better than SPI guidelines of 0.2% • Response time of the molding machine, controller and ram velocity are important to process repeatability. • Weight and thickness show higher COV than length and should be used for QC In-mold instrumentation is vital to achieving process robustness, automatic quality control, and competitiveness.
Acknowledgements National Science Foundation grant numberDMI-0428366/0428669 Priamus System Technologies