Download
1 / 14
140 likes | 330 Views
Using LiDAR Data within Smallworld. Mark Field – FCSI. Overview. LiDAR – We have heard about it, but what is it? How’s it collected What data is in it Variations of LiDAR data How is it stored in Smallworld Example set of tools

E N D
Using LiDAR Data within Smallworld Mark Field – FCSI
Overview • LiDAR – We have heard about it, but what is it? • How’s it collected • What data is in it • Variations of LiDAR data • How is it stored in Smallworld • Example set of tools • How this implementation can be used to develop useful data
What is LiDAR? • Light Detection And Ranging • aka Laser Detection And Ranging (LADAR) • Can be used in side and downward-looking • Laser speed gun, weather “radar”, airborne • Data is gathered by detecting the reflection of the light • Distance, intensity, return number • Raw results are “point clouds”
LiDAR Collection Illustration Source: https://www.e-education.psu.edu/lidar/node/1405
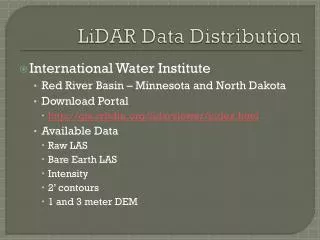
Variations of LiDAR • Raw, Unfiltered Data(LAS format) • Contains noise, artifacts • Filtered, Classified (LAS format) • Contains point cloud data • Multiple returns • Classified into ground, vegetation, building, etc. • Ground Points (LAS format) • Contains single “layer” of ground • Digital Elevation Models (DEM, DTM, TIN) • Rasterized version of ground points
Variations of LiDAR (cont.) • LAZ • Lossless Compressed LAS • Categorized XYZ • ASCII • Files separated into single category
Implementation by FCSI • Expanded FCSI’s N-Dimensional Geometry • 5+ Dimensional TIN Structure (XYZTV) • TIN Node now contains all LiDAR Data • X, Y, Z • Intensity • Return • Number of Returns • Scan Direction • GPS Time • Edge of Flight? • Classification • Scan Angle • User Data • Point Source • Color (RGB)
Example Tools by FCSI • Point Viewer • Points colored by return, intensity, elevation, classification • Filter points by return, intensity, classification • DEM Updater • Update DEM values based off LiDAR • Manual Feature Extraction
Issues with LiDAR • Number of Points is extremely large • 1000’ x 100 ‘ of Missouri contains 560,000 points! • 5000’ x 5000’ 5.3 to 8.2 Million points! • 5.3 Million = 463MB gdb.ds (1MB rwo.ds) • What will it be used for? • DEM/TIN – Rasterize externally • Ensure data is what you want to use • Is it classified? • Does it contain non-ground data (multiple returns)? • External tools do exist that may be more effective
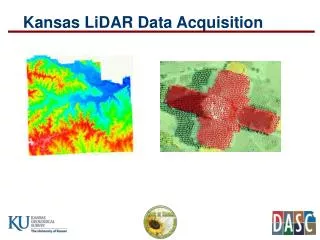
How Can LiDAR Be Used? • Very accurate terrain models • TINs or DEMs • Identify features for corridor management • Buildings • Vegetation • Towers, Poles, Lines
Questions?/Contact • Mark Field • mark@field-csi.com • FCSI Booth 19 • Cell: 407-376-6105 • @mbfbsae90 • mbfbsae90