Download
1 / 26
260 likes | 374 Views
Phosphorus and Suspended Solids TMDL For the Lower Fox River/Green Bay Area of Concern – Putting the Pieces Together. Bud Harris, P. Sager, D. Scheberle, V. Harris, P. Baumgart, D. Robertson, K. Fermanich, M. Finney, J. Kennedy, J. V. Klump UW Green Bay November 2-3, 2005. Mouth.

E N D
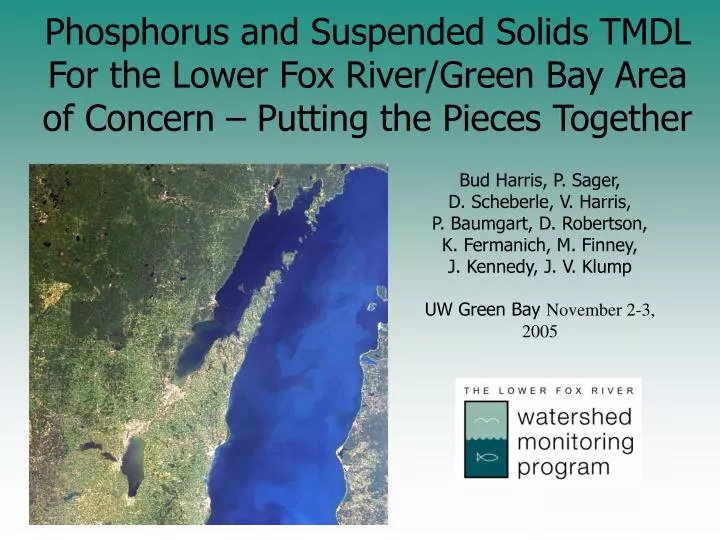
Phosphorus and Suspended Solids TMDL For the Lower Fox River/Green Bay Area of Concern – Putting the Pieces Together Bud Harris, P. Sager, D. Scheberle, V. Harris, P. Baumgart, D. Robertson, K. Fermanich, M. Finney, J. Kennedy, J. V. Klump UW Green Bay November 2-3, 2005
Mouth New London DePere Wrightstown Oshkosh Appleton Berlin Neenah/Menasha Fox-Wolf Basin (16,500 km2) Three Sub-Basins Lower Fox (1,580 km2) 41 Watersheds
Clean Water Act TMDL Requirements in Section 303(d) • identify impaired/threatened waterbodies (P listed in 303d in 2002) • develop TMDLs for those waters 4
TMDL Definition Sum WLA + Sum LA+ {MOS} = TMDL WLA = wasteload allocation (point source loads) LA = load allocation (nonpoint source and background loads) MOS = margin of safety (explicit or implicit) TMDL = total maximum daily load
303(c) 303(d) 303(e) Water Quality Standards Water Quality Controls* TMDLs * Water quality controls include regulatory as well as voluntary controls 6
Nutrient TMDLs Examples of how wq goals and TMDLs could be expressed Water Quality Water Quality Controls TMDL Goals • nitrogen concentration • phosphorus concentration • chlorophyll-a conc. • macrophyte density • Carlson Trophic State Index • tons of in-lake algal biomass • pH • transparency • biological indicators such as • health of fish or macroinvertebrates • dissolved oxygen • ..... • ..... • annual or seasonal loading of nitrogen or phosphorus • percent reduction in nitrogen or phosphorus • ..... • ..... 7
How did we get here? Some important benchmarks • 1965 Federal Water Pollution Control Act • 1970 First Load Estimate for P and SS • 70-80’s Sea Grant Green Bay Subprogram • 80-90’s GBMSD Monitoring Program • 1988 Green Bay Remedial Action Plan • 1990’s Priority Watershed Programs • 1990 State of Bay Report • 1992 NEWWT • 2003 Lower Fox River Watershed Monitoring Program • 2004-05 SWAT modeling for load allocation
Target for TP Based on Algal Growth Rates in Green Bay • Algal growth begins to decline at 45 ug/l TP • At > 100 ug/l, growth rates do not increase
Defining the relationship between total phosphorous and algae Present ambient phosphorous concentration ■ Target level ▲
Secchi Depth Model for Lower Green Bay (by Paul Sager) • Light penetration measured by secchi disk and light meter • Secchi depth = 0.80 – 0.174 TSS – 0.17 VSS – 0.16 Chlor a (r2 = .69) • Sea Grant and Paul Sager currently updating model using recent MSD data
Green Bay AOC TMDLs Phosphorus (P) & Suspended Solids(SS) Water Quality Controls Water Quality Goals TMDL • riparian protection • rotational grazing • conservation tillage • manure mgt • stormwater mgt • P rationing • construction site mgt • urban design • P target • SS target • Secchi disk depth 45µg/l • 50% reduction in P load 7.5 mg/l • 50% reduction in SS load • 1.5 m 15
Mouth New London DePere Wrightstown Oshkosh Appleton Berlin Neenah/Menasha Basin Load Partitioning • Data from GBMSD, DNR,USGS • Estimates by Dale Robertson USGS
Smaller-scale monitoring to identify sources with greater confidence
TMDL Lower Fox River Basin(assume 50% reduction all sources) TMDL (P) = sum WLA + sum LA + MOS = 258,791 Kg/yr / 2 = 129,396 Kg/yr TMDL (SS) = sum WLA + sum LA + MOS = 81,600 mt/yr / 2 = 40,800 mt/yr
Possible Approaches STRATEGIES SCENRARIO ONE Phosphorus in Soil kept at a stable 40 parts per million Vegetated Buffer Strip-installed on 100 percent of the 1:24k hydrology streams Phosphorus in feed for dairy cows is reduced by 25 percent Conservation Tillage current No Till (NT) the rest Mulch Till (MT), and all manure incorporated Intensive Rotational grazing in which 40 percent of dairy farms adopt SCENARIO TWO etc… Individual % Reduction SS P 0% 12.8% 3.5% 4.1% 0% 5.5% 18.7% 16.5% 14.1% 15.3%
Next Steps? www.uwgb.edu/watershed Satellite image May 19, 2000
Phosphorous Reduction Management Strategy • What is the likelihood of success? • Cost effectiveness • Social acceptability • Ecological integrity • True cost pricing • Political Will
TMDL Review Criteria Is the TMDL approvable? • Identification of waterbody/pollutant of concern • Applicable water quality standards and numeric targets • Technical analysis/supporting documentation • Margin of safety & seasonality • TMDL/loading capacity • Wasteload & load allocations • Reasonable assurances nonpoint source controls will be implemented if point source WLAs rely on those controls • Public participation • Monitoring plan (for phased approach) • Implementation plan (not required) 26