Download

1 / 35
350 likes | 548 Views
Dr. Ron Lembke. Solving Linear programs using excel. Formulating in Excel. Write the LP out on paper, with all constraints and the objective function. Decide on cells to represent variables. Enter coefficients of each variable in each constraint in a block of cells.

E N D
Dr. Ron Lembke Solving Linear programs using excel
Formulating in Excel • Write the LP out on paper, with all constraints and the objective function. • Decide on cells to represent variables. • Enter coefficients of each variable in each constraint in a block of cells. • Compute amount of each constraint being used by current solution.
Formulating in Excel 5. Place inequalities in sheet, so you remember <=, >= 6. Enter amount of each constraint 7. Enter objective coefficients 8. Calculate value of objective function 9. Make sure you have plenty of labels. 10. Widen columns for readability.
Standard Form Max 7x1 + 5x2 s.t. 4x1 + 3x2 <= 240 2x1 + 1x2 <= 100 x1 >= 0 x2 >= 0 electronics assembly
Formulating in Excel Current value of variables Constraint coefficients
Formulating in Excel Amount of each constraint used by current solution
Formulating in Excel Objective Function Value Objective Function Coefficients RHS of constraints, Inequality signs.
Fancy “What If” Tool Trial and error Simplifies the math Can’t solve it for us
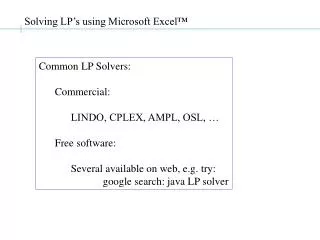
Solving in Excel All we have so far is a big ‘what if” tool. We need to tell the LP Solver that this is an LP that it can solve. • Choose ‘Solver’ from ‘Tools’ menu
Solving in Excel • Choose ‘Solver’ from ‘Data’ tab • Tell Solver what is the objective function, and which are variables. • Tell Solver to minimize or maximize
Solver Dialog Box Set the Target Sell Tell to minimize or maximize Where the variables are
Solving in Excel • Choose ‘Solver’ from ‘Tools’ menu • Tell Solver what is the objective function, and which are variables. • Tell Solver to minimize or maximize • Add constraints: • Click ‘Add’, enter LHS, RHS, choose inequality • Click ‘Add’ if you need to do more, or click ‘Ok’ if this is the last one. • Add rest of constraints
Assuming Linear • You have to tell Solver that the model is Linear. Click ‘options,’ and make sure the ‘Assume Linear Model’ box is checked.
Assuming Linear • You have to tell Solver that the model is Linear. Click ‘options,’ and make sure the ‘Assume Linear Model’ box is checked. On this box, checking “assume non-negative” means you don’t need to actually add the non-negativity constraints manually. • Solve the LP: Click ‘Solve.’ Look at Results.
Office 2010 Options • Set maximum time to look for a solution • OR maximum # of iterations • Our problems should solve quickly
Solution is Found When a solution has been found, this box comes up. You can choose between keeping the solution and going back to your original solution. Highlight the reports that you want to look at.
Optimality Conditions? 200 160 120 T T-shirts 80 Each time we go to another solution, Objective value gets better 40 0 0 50100150200 S Sweatshirts
Optimality Conditions • Simplex method creates “dual” • Max has a min dual, min has a max dual • Dual and “primal” converge to same value • Solution must be optimal
Answer Report • Gives optimal and initial values of objective function • Gives optimal and initial values of variables • Tells amount of ‘slack’ between LHS and RHS of each constraint, tells whether constraint is binding.
Sensitivity Report Variables: • Final value of each variable • Reduced cost: how much objective changes if current solution is changed • Objective coefficient (from problem)
Sensitivity Report Variables: • Allowable increase: How much the objective coefficient can go up before the optimal solution changes. • Allowable decrease: How much the objective coefficient can go down before optimal solution changes. • Both of these only are accurate for changes made to one variable at a time. If you change more than one variable, need to re-solve the LP. • Suppose t-shirts had increase of $5 decrease $10 • Solution is optimal if t-shirt profits are between $15-$30
Sensitivity Report Constraints • Final Value (LHS) • Shadow price: how much objective would change if RHS increased by 1.0 • Allowable increase, decrease: how wide a range of values of RHS shadow price is good for. • Also only accurate for changes made to one constraint at a time • To see the impact of changing more than one constraint, we just have to re-run the problem
Limits Report • Tells ranges of values over which the maximum and minimum objective values can be found. • Rarely useful
Summary • Entered the LP into Excel • Opened Solver, told it how we wanted to solve the LP • Interpreting results of Solver Reports • Answer report – basic results • Sensitivity – how much the situation would change with different profits per unit, or amounts of constraints