Download
1 / 54
540 likes | 884 Views
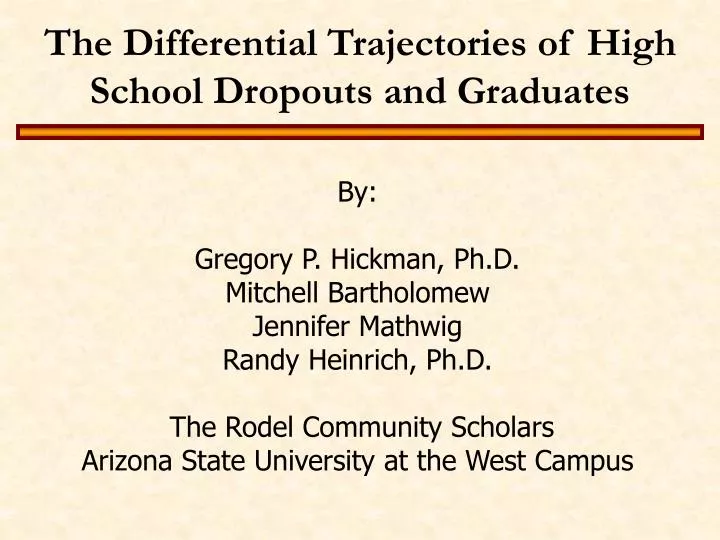
The Differential Trajectories of High School Dropouts and Graduates. By: Gregory P. Hickman, Ph.D. Mitchell Bartholomew Jennifer Mathwig Randy Heinrich, Ph.D. The Rodel Community Scholars Arizona State University at the West Campus . Research Questions.

E N D
The Differential Trajectories of High School Dropouts and Graduates By: Gregory P. Hickman, Ph.D. Mitchell Bartholomew Jennifer Mathwig Randy Heinrich, Ph.D. The Rodel Community Scholars Arizona State University at the West Campus
Research Questions • Are there differences in the developmental trajectories of high school • graduates compared to high school dropouts? • If so, where do these differences occur developmentally in time and • across which variables? • If differences do exist developmentally in time and across variables • which variables exhibit the greatest differences between high school • graduates and dropouts? • Of the variables that exhibit the greatest differences between high • school graduates and dropouts which of these variables accounts for • the most variance for dropping out of high school? • Do high school graduates and dropouts academically perform in the • classroom with equal rigor parallel to standardized testing?
Method of Study • Obtained familial, disciplinary, and educational data • All data were from student K-12 files • Partnered with County Juvenile Probation Office for official data • Sampled 4 cohorts (2002-2005) • Randomly selected 60 graduates and 60 dropouts from 4 cohorts • n=119 (one student was disqualified from study – no data) • n represents approximately 25% of total population of 4 cohorts • Examined the longitudinal developmental trajectory of both • graduates and dropouts across time and all variables of study. • Independent t-tests examined mean differences between groups • Regression Analysis examined the predictive nature of variables • between high school dropouts and graduates
Family & Demographics 0=Married, Female, Born in AZ, and Caucasian 1=Divorced, Male, Not born in AZ, and all other ethnic backgrounds
Vocational Courses 0=Yes, 1=No
Retained K-8? 0=Yes, 1=No
Qualitative Reading Grades K-2 0=Satisfactory, 1=Needs Improvement, 2=Unsatisfactory
Qualitative Spelling Grades K-2 0=Satisfactory, 1=Needs Improvement, 2=Unsatisfactory
Qualitative English Grades K-2 0=Satisfactory, 1=Needs Improvement, 2=Unsatisfactory
Qualitative Writing Grades K-2 0=Satisfactory, 1=Needs Improvement, 2=Unsatisfactory
Qualitative Math Grades K-2 0=Satisfactory, 1=Needs Improvement, 2=Unsatisfactory
Qualitative Social Studies Grades K-2 Graduates & Dropouts all performed at Satisfactory from Kindergarten through 2nd Grade
Qualitative Science Grades K-2 Graduates & Dropouts all performed at Satisfactory from Kindergarten through 2nd Grade
Stanford Grades 5-9 NCE Mechanics/Usage of Language 0=Below Average, 1=Average, 2=Above Average
Stanford Grades 5-9 NCE Interpretation of Reading/Language 0=Below Average, 1=Average, 2=Above Average
Grade Level Dropped Out of High School? High School Dropouts exited school at grade level 10.43
Other High School English Data Grade in Highest English Course Taken Highest English Course Taken
Other High School Math Data 0=Pre-Algebra, 1=Algebra 1, 2=Geometry, 3=Algebra 2, 4=Trigonometry, 5=Calculus
Personal Data 0=No, 1=Yes
Personal Data 0=No, 1=Yes
Did the Student Have Discipline Issues? 0=No, 1=Yes
Was Student Placed in Diversion Programs, Standard Probation, or Intense Probation? 0=No, 1=Yes
First Statistically Significant Differences Between High School Graduates & Dropouts Absenteeism – Kindergarten Reading – Kindergarten Spelling – 2nd Grade English – 2nd Grade Writing – Kindergarten Math – Kindergarten Social Studies – 3rd Grade Science – 4th Grade Stanford 6 – All strands of test Iowa Basic Skills Test – 3rd Grade Reading & Math All High School variables from 9th grade 1st semester
10 Largest Statistical Differences Between Graduates & Dropouts • Did they take a foreign language? • GPA 9th Grade 1st Semester • Did they have discipline issues? • 7th Grade Reading grade • 8th Grade English grade • 8th Grade Absenteeism • 7th Grade Math grade • Total Non-Core classes taken in 9th Grade • Did they participate in extra curricular activities? • Were they retained?
Which Top 10 Variables Have Most Predictive Power? • Foreign Language • English 8th Grade • Absenteeism 8th Grade • Total Non-Core Classes 9th Grade Year • Extra Curricular Activities • These 5 variables account for 78% of the variance of high school • dropouts
Grade Subject Performance vs. Standardized Testing SubjectDropouts Graduates Iowa 1st Grade Reading -.27 .09 1st Grade Reading Grade -.80 .33 Iowa 6th Grade Reading -.55 .20 6th Grade Reading Grade -.63 .36 Standardized Values Dropouts perform significantly lower in the classroom compared to their standardized testing ability in 1st grade reading. Whereas, graduates perform significantly higher in the classroom compared to their standardized testing ability. The same holds true for dropouts in 6th grade, however the margin is not significant. Finally, while dropouts make slight improvements in their classroom grades they decrease significantly in their standardized testing over time.
Grade Subject Performance vs. Standardized Testing SubjectDropouts Graduates Stanford 5th Grade Math -.28 .24 5th Grade Math Grade -.35 .19 Stanford 8th Grade Math -.57 .29 8th Grade Math Grade -.73 .30 Standardized Values Dropouts perform slightly lower in the classroom compared to their standardized testing ability in 5th grade math. Whereas, graduates perform slightly higher in the classroom compared to their standardized testing ability. As time progresses graduates achieve with equal rigor on standardized testing and in the classroom, whereas dropouts significantly achieve less in the classroom overtime compared to their standardized testing ability. Not only do dropouts decrease in their classroom and standardized performances over time, but the gap in classroom performance becomes further behind their standardized testing ability.