Download
1 / 8
80 likes | 216 Views
MIDTERM. Raquel Gray SOWK300-01 FA2009. Variables and Values. Hypotheses and Rationale Bivariate. As the years go on, if your older the more likely food for you to be married. As you get older the number of widowed increase as well. Marital Status. Years.

E N D
MIDTERM Raquel Gray SOWK300-01 FA2009
Hypotheses and Rationale Bivariate As the years go on, if your older the more likely food for you to be married. As you get older the number of widowed increase as well. Marital Status Years
Hypotheses and Rationale Multivariate As the years goes on, the number of married people go up. The numbers are about the same n both male and female cases. Sex Years Marital Status
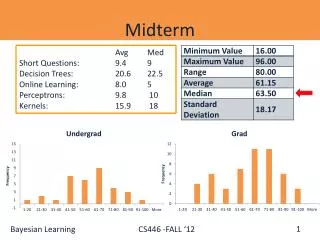
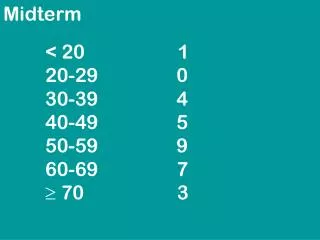
Bivariate Graph & Discussion • The graph shows that more people between the ages of 18 to 29 have never married vs. someone in their 50’s. People in the 30-39 are most likely to get separated. People over 50 have the highest widowed rate. An people betwwen 40 to 49 are the ones married.
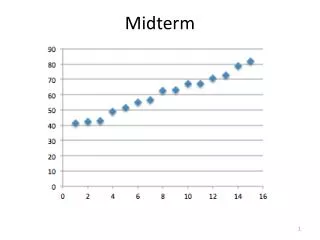
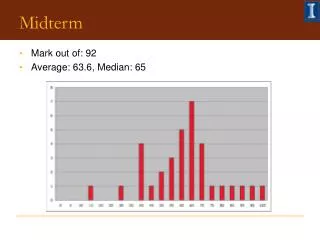
Multivariate Graph & Discussion • This graph compares the two sex in their marital status. There has been more females married then man, males have the leading case in widowed. Also, most males have been divorced and separated. More females have never been married.