Download
1 / 20
200 likes | 407 Views
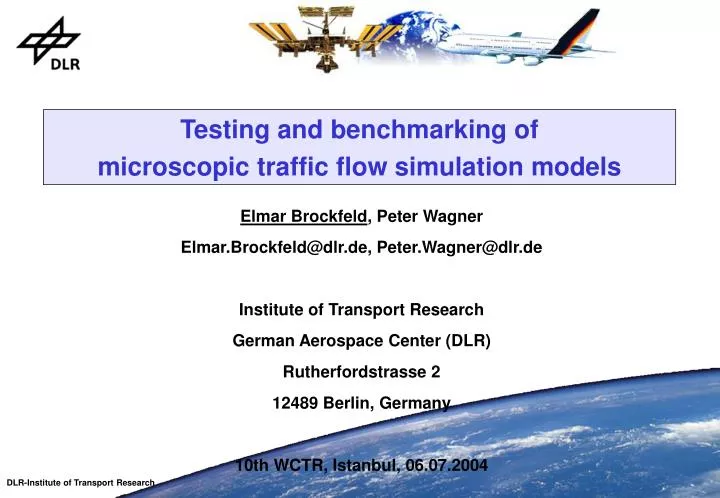
Testing and benchmarking of microscopic traffic flow simulation models. Elmar Brockfeld , Peter Wagner Elmar.Brockfeld@dlr.de, Peter.Wagner@dlr.de Institute of Transport Research German Aerospace Center (DLR) Rutherfordstrasse 2 12489 Berlin, Germany 10th WCTR, Istanbul, 06.07.2004.

E N D
Testing and benchmarking ofmicroscopic traffic flow simulation models Elmar Brockfeld, Peter Wagner Elmar.Brockfeld@dlr.de, Peter.Wagner@dlr.de Institute of Transport Research German Aerospace Center (DLR) Rutherfordstrasse 2 12489 Berlin, Germany 10th WCTR, Istanbul, 06.07.2004
„State of the art“ • The situation in microscopic traffic flow modelling today: • A very large number of models exists describing the traffic flow. • If they are tested, this is done separately with special data sets. • By now the microscopic models are quantitatively not comparable.
Motivation • Idea • Calibrate and validate microscopic traffic flow models with the same data sets. ( quantitative comparibility, benchmark possible ?) • Calibration and validation in a microscopic way by analysing any time-series produced by single cars. • In the following • Calibration and validation of ten car-following models with data recorded on a test track in Hokkaido, Japan. • Comparison with results of other approaches.
Test track Hokkaido, Japan curve 300 m 1200 m • 10 cars equipped with DGPS driving on a 3km test track • Delivery of positions in intervals of 0.1 second
Hokkaido, Japan – The data • Data recorded by Nakatsuji et al. in 2001 • Data from 4 out of 8 experiments are used for the analyses: • Exchange of drivers between the cars after each experiment • Leading car performed certain “driving patterns” on the straight sections: • driving with constant speeds of 20, 40, 60 and 80 km/h • driving in waves varying from about 30 to 70 km/h
Hokkaido, Japan – Speed development • Speed development of the leading car in all four experiments
follower leader The models The following existing models have been analysed: • 4 parameters, CA0.1 („cellular automaton model“) • 4 p, OVM (“Optimal Velocity Model” by Bando) • 6 p, GIPPSLIKE (basic model by P.G. Gipps) • 6 p, AERDE (used in the software INTEGRATION) • 6 p, IDM (“Intelligent Driver Model” by D. Helbing) • 7 p, IDMM (“Intelligent Driver Model with Memory”) • 7 p, SK_STAR (based on the model by S. Krauss) • 7 p, NEWELL (CA-variant of the model with more variable acceleration and deceleration by G. Newell) • 13 p, FRITZSCHE (used in the british software PARAMICS; similar to what is used in the german software VISSIM by PTV) • 15 p, MITSIM (used in the software MitSim)
The model‘s parameters • Parameters used by all models: • V_max Maximum velocity • l Vehicle length • a acceleration • Most models: • b deceleration • tau reaction time • Models with different driving regimes: • MITSIM and FRITZSCHE Java Applet for testing the models
Hokkaido, Japan - Simulation setup V_sim V_data gap • For each simulation run one vehicle pair is under consideration • Movement of leading car: as recorded in the data • Movement of following car: following the rules of a traffic model • Error measurement: • e percentage error • T time series of experiment • g(obs) observed gaps/headways • g(sim) simulated gaps/headways • Objective of calibration: Minimize the error e !
Hokkaido, Japan – Calibration and Validation Calibration (“Adjust parameters of a model to real data”) • Find the optimal parameter sets for each vehicle pair in each experiment (9*4 = 36 calibrations for each model): • Minimize the error e as defined before • Minimization with a gradient free (direct search) optimisation algorithm (“downhill simplex” or “Nelder-Mead”) • To avoid local minima: about 100 simulations with random initializations Validation (“Apply calibrated model to other real data sets”) • For each model all optimal parameter results are transferred to data sets of three other driver pairs (in total 108 validations for each model)
Hokkaido, Japan - Calibration Results (1/2) Results of the first experiment “11” • Errors between 9 and 19 %, mostly between 13 and 17 % • No model appears to be the best
Diversity in Diversity driver behaviour of models (6 %) (2.5 %) > Hokkaido, Japan - Calibration Results (2/2) • Calibration error: mostly 12 - 18 % (range 9 - 23 %) • All models share the same problems with the same data sets -> Which is the best model? • Average error of best model: 15.14 % • Average error of worst model: 16.20 % • Models with more parameters do not produce better results • Average difference of the models per data set is 2.5 percentage points Calibration of 10 models with 36 data sets ( 4 experiments „11“, „12“, „13“ and „21“, each with 9 driver pairs):
Hokkaido, Japan - Validation Results (1/2) • Validation error: mostly 17 - 27 % • “Overfitting 1”: Special driver behaviour may produce high errors up to 40 or 50 % for all models • “Overfitting 2”: For some driver pairs some models produce singular high errors of more than 100 % Validation of each calibration result with three other driver pairs (->108 validations for each model) Sample plots for 2*9 validations
Hokkaido, Japan - Validation Results (2/2) Distribution functions of the errors • Calibration errors: 12 - 18 % (peak 15-17) • Validation errors: 17 - 27 % (peak 21-23) • Additional validation error to calibration: 6 percentage points • Calibration: MEDIAN best/worst model: 14.84 % / 16.04 % • Validation: MEDIAN best/worst model: 21.60 % / 22.58 % • Additional validation error to calibration: 5.66 pp / 7.23 pp
Conclusions Essential results: • Minimum reachable levels for calibration: • Short traces or special situations: 9 to 11 % • Simulating more than a few minutes: 15 to 20 % • Minimum reachable levels for validation: • > 20 % ; about 3 to 7 percentage points higher than calibration case. • The analysed models do not differ so much • The diversity in the driver behaviour is bigger than the diversity of the models. • Models with more parameters must not necessarily produce better results than simple ones. • Preliminary advice: Take the simplest model or the one you know best!
Perspectives and future research • Testing more models and more data sets • Test some other calibration techniques and measurements (speeds, accelerations,…) • Sensitivity analyses of the parameters (robustness of the models) • What are the problems of the models? Analysisofparameter results. Development of better models. • Finally development of a benchmark for microscopic traffic flow models.
THANK YOU • FOR YOUR ATTENTION !