Download
1 / 11
110 likes | 712 Views
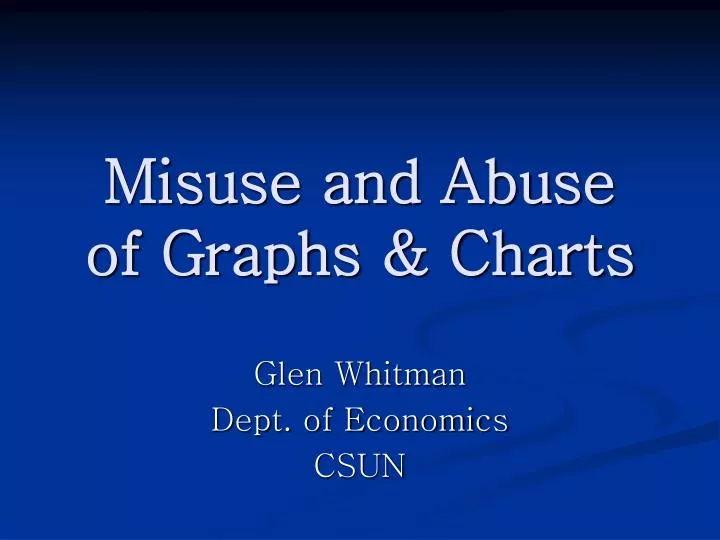
Misuse and Abuse of Graphs & Charts. Glen Whitman Dept. of Economics CSUN. Beware of Pictograms: America’s Expanding Waistline. Source: Women’s Health , May 2006. Beware of Pictograms: The Dominance of McDonald’s. Source: http://www.princeton.edu/~ina/infographics/starbucks.html.

E N D
Misuse and Abuseof Graphs & Charts Glen Whitman Dept. of Economics CSUN
Beware of Pictograms:America’s Expanding Waistline Source: Women’s Health, May 2006
Beware of Pictograms:The Dominance of McDonald’s Source: http://www.princeton.edu/~ina/infographics/starbucks.html
Beware of Pictograms:The Growth of Starbucks Source: http://www.princeton.edu/~ina/infographics/starbucks.html
Slicing Up Pie Charts:Rampant Illegal Downloading? 1% slice = Estimated capacity of all iPod capacity filled by iTunes songs 99% slice = Estimated capacity of all iPod capacity not filled by iTunes songs Source: Wired, May 2006
Slicing Up Pie Charts:World Oil Reserves Source: Business Week, May 15, 2006
Slicing Up Pie Charts:Compared to What? Source: http://www.samefacts.com/archives/_/2006/06/pita_for_the_second_gilded_age.php and http://agoraphilia.blogspot.com/2006/07/slicing-up-tax-pie.html
Pay Attention to the Scale:Are CSUN Professors Underpaid? Source: A flyer I found in the faculty mailroom
Pay Attention to the Scale:Changing Marital Norms Source: Business Week, October 20, 2003
Pay Attention to Scale:Weight Loss Products Source: unknown magazine; same data displayed at http://www.hydroxycut.com/MEN/PRODUCT_FACTS/HYD_24/index.shtml
Meaningless Line Graphs Source: Unknown, found in faculty mailroom