Download
1 / 33
370 likes | 708 Views
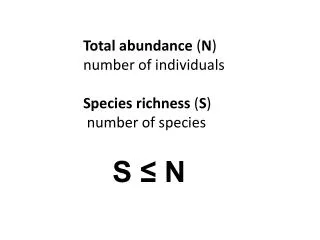
Species richness. The number of species is an important biological variable that scientists try to quantify. Species diversity. The number of species weighted by their abundance.

E N D
Species richness The number of species is an important biological variable that scientists try to quantify
Species diversity The number of species weighted by their abundance. For example, a forest with 10 tree species, each with ten individuals, is generally considered more diverse than a forest with 10 tree species, one of which is represented by 91 individuals with the other 9 species only represented by one individual each.
To estimate species richness one must first sample an area(s)
Sampling is measuring a small part of an entity assuming that this small part is representative of the larger entity
Ways to diminish biases in sampling Use multiple sampling techniques Sample at random locations (each location has an equal opportunity of being sampled--in other words, sampling should not be biased in favor of some locations and against other locations) Sample repeatedly
In addition to sampling correctly, it is important to recognize that not all species are equally detectable
In addition, species may vary in their detectability across habitat types
Generally, the number of species detected (observed) through sampling, is not the best estimate of the species richness of an area
Ways to look at patterns and estimate diversity after sampling is completed Diversity indices Accumulation curves/Rarefaction curves Using species abundance distribution data
Shannon Diversity Index Also known as the Shannon-Wiener or Shannon-Weaver. This index uses species abundances to calculate an index of diversity H = -Σ pi ln(pi) pi= proportion of the ith species
Imagine the following are the abundances of individuals in a community of frogs detected by a biologist Species 1 = 15 Species 2 = 10 Species 3 = 3 Species 4 = 1
H = -Σ pi ln(pi) 15+10+3+1 = number of individuals in the community p1 = 15/29, p2 = 10/29, p3=3/29, p4=1/29 H = -Σ (0.52(ln0.52)+(0.34(ln0.34)+(0.10(ln0.10) + 0.03(ln0.03) = 1.05 1.05 = diversity index, which we compare to other, similarly calculated diversity indices if we want to compare the diversities of different communities
Assumption of Shannon Index All species are equally detectable This assumption may be more true for some taxonomic groups than others. In general, for mobile organisms, the Shannon Index is not a strong way to estimate diversity
Accumulation curve—”records the total number of species revealed, during the process of data collection, as additional individuals (or sample units) are added to the pool of all previously observed or collected individuals or samples” Gotelli, N.J. and R. K. Colwell. 2001. Ecology Letters 4:379-391.
Tabanid fly species accumulation curves for La Selva and 1070 m in Braulio Carillo A Report on the Tabanidae of La Selva Biological Station and 1070m in Braulio Carrillo National Park Taxonomic Collaborator: John F. Burger, Department of Zoology, Spaulding Hall University of New Hampshire, Durham, New Hampshire 03824 USA. Page author: John T. Longino, The Evergreen State College, Olympia WA 98505 USA
Accumulation curves show differences in species richness, given the number of individuals detected When these curves reach an asymptote, sampling may be reasonably complete
Rarefaction curves are produced by “repeatedly re-sampling the pool of N individuals or N samples, at random, plotting the average number of species represented by 1, 2,…N individuals or samples. Sampling is generally done without replacement”
Rarefaction curves represent the statistical expectation for the corresponding accumulation curve
Black line is accumulation curve, red line is rarefaction curve, dashed lines are confidence Intervals. Rarefaction curve is based on 100 samples. Data are for bats at site in Malaysia. http://www.wcsmalaysia.org/analysis/Biod_richness.htm
Williams et al. 2001. Variation in native bee faunas and its implications for detecting community change. Ecology and Society 5:7
If one bases rarefaction curves on numbers of samples versus individuals, one needs to be careful If the density of individuals differs among samples, results will be misleading
Because each sample from second growth forest has more individuals than each sample from old growth forest, the samples for the two types of forest are not directly comparable. Second growth forest is denser, greater no. of individuals, so rarefying with samples gives mis- leading result that second growth forest is more species-rich. Rarefying with individuals controls for density differences. From Gotelli and Colwell 2001.
Another technique for comparing species richness Use program Specrich, available at http://www.mbr-pwrc.usgs.gov/software/specrich.html Patuxent Wildlife Research Center website
Which community do you think has a greater species richness?
Species abundance distribution data (as presented in the previous slide) are used to estimate species richness in this method.
Characteristics of particular taxonomic or ecological groups that are more likely to be more species-rich than others? Characteristics of particular environments that are more likely to be more species-rich than others?
Planting design-- In islands or plantations? Control Island Plantation