Download
1 / 18
180 likes | 308 Views
Stratospheric Ozone : Depletion and Recovery. Eun-Su Yang 1 , Ross J. Salawitch 2 , Derek Cunnold 3 , Michael J. Newchurch 1 , M. Patrick McCormick 4 , James Russell III 4 , Joseph Zawodny 5 , Sam Oltmans 6 1 Univ of Ala, Huntsville, 2 Univ of Md, 3 Ga. Tech,

E N D
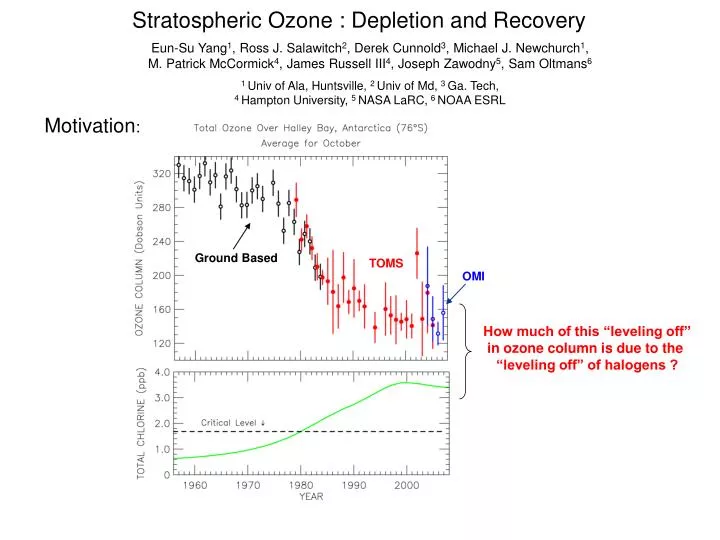
Stratospheric Ozone : Depletion and Recovery Eun-Su Yang1, Ross J. Salawitch2, Derek Cunnold3, Michael J. Newchurch1, M. Patrick McCormick4, James Russell III4, Joseph Zawodny5, Sam Oltmans6 1 Univ of Ala, Huntsville, 2 Univ of Md, 3 Ga. Tech, 4 Hampton University, 5 NASA LaRC, 6 NOAA ESRL Motivation: Ground Based TOMS OMI How much of this “leveling off” in ozone column is due to the “leveling off” of halogens ?
WMO 2007 (Chapter 6) First Stage of Ozone Recovery The occurrence of a statistically significant reduction in the rate of decline of ozone due to changing ozone depleting substances
First Stage of Ozone Recovery – Slowing of Decline 1997 is theCritical Time to look for recovery of Polar Ozone EESC: Equivalent Effective Stratospheric Chlorine 1997
Complication #1 Large year to year variability in temperature
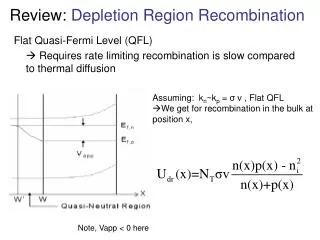
Complication #2 Ozone reaches “zero” over considerable height range. This “saturation effect” may be the cause of the “leveling off” of the column ozone time series NOAA ESRL Ozonesonde Data: http://www.esrl.noaa.gov/gmd/dv/spo_oz/sondes
September October Extra-Vortex Collar Vortex Equivalent Latitude Equivalent Latitude Data sources: ▪ SAGE II, HALOE, Sondes, Brewer/Dobson ▪ Classify data as vortex, collar, or extra vortex using Equivalent latitude at 440 K (Nash criteria; PV from NCEP reanalysis)
Total Ozone: October, Vortex Core Record Cold Ozone (DU) Early Warming
Scatter plot, Detrended Total O3 vs Detrended Temperature (440 K) : Cold winters associated with larger vortices and less ozone, due to combination of “dynamical effects” and “chemical effects” related to availability of PSCs (Boedeker et al., 2002; Newman et al., 2004; Huck et al., 2005)
Scatter plot, Detrended Total O3 vs Detrended Temperature (440 K) : We use slopes of these curves, together with yearly T residual, to derive Ozone Time Series that account for yearly variations in temperature and dynamics
Total Ozone: October, Vortex Core Record Cold Ozone (DU) Early Warming
Record Cold Ozone (DU) Early Warming Total Ozone: October, Vortex Core ▪ Have dealt with Complication #1 (Meteorology) ▪ Now, must deal with Complication #2 (Loss Saturation)
Difference Attributable to Loss Saturation Loss Saturation, Method #1 : PDFs of Total Column Ozone October vortex core: mean ozone is 13 DU higher during 1994 to 2007 time period than “predicted ozone” found using O3 vs T residual relation from 1979 to 1991 time period September: no discernable saturation effect, in either core or collar October vortex collar: 13 DU effect
Ozonesondes SAGE II Loss Saturation, Method #2 : (O3) vs (T) in layers October vortex core: ozonesonde saturation effect : 10.1 DU (3.1 + 4.3 + 2.7) SAGE II saturation effect: 13.6 DU (5.3 + 4.4 + 3.9 )
Ozonesondes SAGE II Loss Saturation, Method #2 : (O3) vs (T) in layers October vortex core: ozonesonde saturation effect : 10.1 DU (3.1 + 4.3 + 2.7) SAGE II saturation effect: 13.6 DU (5.3 + 4.4 + 3.9 ) Adjust Total Ozone Time series by 13 DU (mean value of loss saturation for 1994 to 2006), with coldest years having larger adjustments
Total Ozone: October, Vortex Core Record Cold Early Warming Polar EESC
Trend Analysis: Sept Core Oct Core Sept Collar Oct Collar
Black: Cumulative Sum of Residuals (i.e., deviation of data from fit) CUSUM Analysis: Sept Core Oct Core Sept Collar Blue dotted: 95% confidence limit Oct Collar
Conclude: ▪ Antarctic Ozone, within both core and collar regions, is in first stage of recovery due to the leveling off of ozone depleting substances ▪ In plain English: chemical loss is not getting any worse (use of word “recovery” seems strange to me, but the community has chosen this word to describe this situation!) ▪ Yearly variations in Antarctic ozone are now driven by meteorology ▪ Cold winters low ozone ▪ Next stage of recovery (actual improvement in ozone) not likely to occur until middle of next decade (Newman et al., GRL, 2006)