Download
1 / 1
10 likes | 78 Views
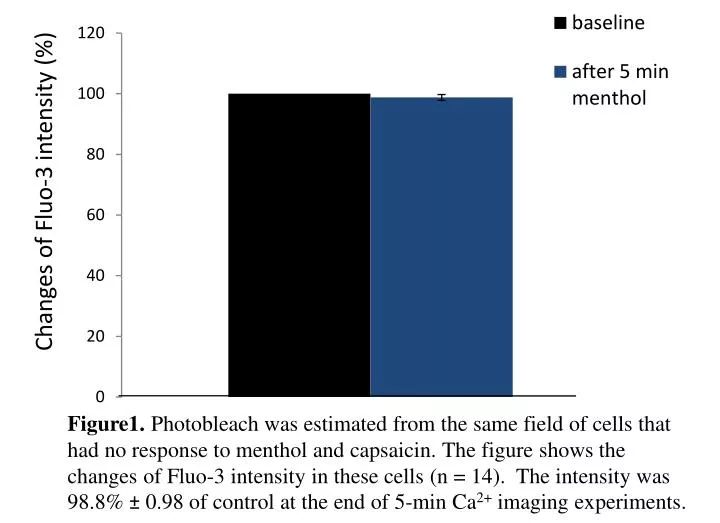
This figure displays the variations in Fluo-3 intensity in cells unresponsive to menthol and capsaicin. The photobleaching estimation was derived from the same cell field. The final intensity was 98.8% ± 0.98 of control post 5-minute Ca2+ imaging.

E N D
Changes of Fluo-3 intensity (%) Figure1. Photobleach was estimated from the same field of cells that had no response to menthol and capsaicin. The figure shows the changes of Fluo-3 intensity in these cells (n = 14). The intensity was 98.8% ± 0.98 of control at the end of 5-min Ca2+ imaging experiments.