Download
1 / 105
1.06k likes | 1.25k Views
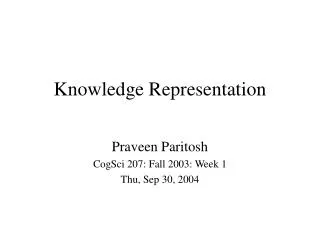
Knowledge Representation using Information Visualization. Remco Chang Computer Science. Outline. Role of Information Visualization For storytelling For data analysis As knowledge externalization Information Visualization at a Glance Data to visual element mapping

E N D
Knowledge Representation using Information Visualization Remco Chang Computer Science
Outline • Role of Information Visualization • For storytelling • For data analysis • As knowledge externalization • Information Visualization at a Glance • Data to visual element mapping • Colors, perception, and cognitive biases • Projects at Tufts • Just Noticeable Differences (JND) • Bayesian Reasoning
Storytelling: Hans Rosling’sGapminder • http://www.youtube.com/watch?v=jbkSRLYSojo
Data Analysis: Trapping Pi Analysis Slide courtesy of Dr. Pat Hanrahan, Stanford
Data Analysis: Trapping Pi Analysis Slide courtesy of Dr. Pat Hanrahan, Stanford
Data Analysis: Trapping Pi Analysis Slide courtesy of Dr. Pat Hanrahan, Stanford
Data Analysis: Trapping Pi > > Analysis Slide courtesy of Dr. Pat Hanrahan, Stanford
Data Analysis: Trapping Pi 3.14286 3.140845 > > Analysis Slide courtesy of Dr. Pat Hanrahan, Stanford
Knowledge Externalization: Number Scrabble Slide courtesy of Dr. Pat Hanrahan, Stanford
Knowledge Externalization: Number Scrabble Slide courtesy of Dr. Pat Hanrahan, Stanford
Knowledge Externalization: Number Scrabble Slide courtesy of Dr. Pat Hanrahan, Stanford
Knowledge Externalization: Number Scrabble Slide courtesy of Dr. Pat Hanrahan, Stanford
Knowledge Externalization: Number Scrabble Slide courtesy of Dr. Pat Hanrahan, Stanford
Knowledge Externalization: Number Scrabble Slide courtesy of Dr. Pat Hanrahan, Stanford
Knowledge Externalization: Number Scrabble Slide courtesy of Dr. Pat Hanrahan, Stanford
Knowledge Externalization: Number Scrabble Slide courtesy of Dr. Pat Hanrahan, Stanford
Knowledge Externalization: Number Scrabble Slide courtesy of Dr. Pat Hanrahan, Stanford
Knowledge Externalization: Number Scrabble Slide courtesy of Dr. Pat Hanrahan, Stanford
Knowledge Externalization: Number Scrabble Slide courtesy of Dr. Pat Hanrahan, Stanford
Knowledge Externalization: Number Scrabble Slide courtesy of Dr. Pat Hanrahan, Stanford
Knowledge Externalization: Number Scrabble Slide courtesy of Dr. Pat Hanrahan, Stanford
Knowledge Externalization: Number Scrabble ? Slide courtesy of Dr. Pat Hanrahan, Stanford
Knowledge Externalization: Number Representations • Zhang and Norman (1995). The Representation Of Numbers. Cognition.
Knowledge Externalization: Number Representations Slide courtesy of Pat Hanrahan
Knowledge Externalization: Number Representations Slide courtesy of Pat Hanrahan
Knowledge Externalization: Number Representations Slide courtesy of Pat Hanrahan
Information Visualization, a Summary • Unfortunately, while the visualization of information holds a great deal of promise for storytelling, data analysis, and knowledge externalization, there is still no principled way of creating effective visualizations. • The three major theoretical underpinnings for information visualization remain very “low level”: • Color theory • Perceptual theory • Data-visual mapping
Information Visualization, a Summary (2) • As such, the field remains in an “exploratory” phase where: • We design new visualizations based on intuition and creativity • And we test their effectiveness against the current state of the art • And we hope that through these evaluations, we being to understand “why” some visual designs are more effective than others • This is why collaboration with Psych and Cog Sci is so important! • It affords a “model-driven” approach to understanding visualization • We can borrow known models or theories (such as distributed cognition) to better understand visualization practice
Basic Data Types Def: A set of not-ordered and non-numeric values For example: Categorical (finite) data {apple, orange, pear} {red, green, blue} Arbitrary (infinite) data {“12 Main St. Boston MA”, “45 Wall St. New York NY”, …} {“John Smith”, “Jane Doe”, …} • Nominal • Ordinal • Scale / Quantitative • Interval • ratio
Basic Data Types Def: A tuple (an ordered set) For example: Numeric <2, 4, 6, 8> Binary <0, 1> Non-numeric <G, PG, PG-13, R> • Nominal • Ordinal • Scale / Quantitative • Interval • ratio
Basic Data Types Def: A numeric range Interval Ordered numeric elements on a scale that can be mathematically manipulated, but cannot be compared as ratios For example: date, current time (Sept 14, 2010 cannot be described as a ratio of Jan 1, 2011) Ratio where there exists an “absolute zero” For example: height, weight • Nominal • Ordinal • Scale / Quantitative • Interval • ratio
Basic Data Types (Formal) • Nominal (N) {…} • Ordinal (O) <…> • Scale / Quantitative (Q) […] • Q → O • [0, 100] → <F, D, C, B, A> • O → N • <F, D, C, B, A> → {C, B, F, D, A} • N → O (??) • {John, Mike, Bob} → <Bob, John, Mike> • {red, green, blue} → <blue, green, red>?? • O → Q (??) • Hashing? • Bob + John = ?? Readings in Information Visualization: Using Vision To Think. Card, Mackinglay, Schneiderman, 1999
Operations on Basic Data Types • What are the operations that we can perform on these data types? • Nominal (N) • = and ≠ • Ordinal (O) • >, <, ≥, ≤ • Scale / Quantitative (Q) • everything else (+, -, *, /, etc.) • Consider a distance function
Connecting Data To Visualization • Data have attributes (dimensions) • Visualizations have attributes (dimensions) • Can the two map to each other? • Jacques Bertin, SemiologieGraphique (Semiology of Graphcis), 1967.
Elements of Visualization • Images are composed of marks: “ink”, graphical primitives Slide courtesy of Sara Su
Elements of Visualization Slide courtesy of Sara Su
Value (Intensity) • Discrete or Continuous? Slide courtesy of Sara Su
Color (Hue) • Discrete or Continuous? Slide courtesy of Sara Su
Visual Variables Slide courtesy of Sara Su