Download

1 / 33
350 likes | 608 Views
Radar Meteorology Laboratory Rain from Doppler Radar data. Prof. LEE, Dong-In 23 November 2000. Object: To get rainfall from radar data. Theory:. Add appropriate theory from text or other sources. Radar reflectivity factor.

E N D
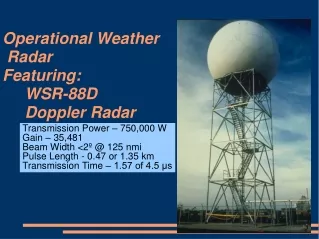
Radar Meteorology LaboratoryRain from Doppler Radar data Prof. LEE, Dong-In 23 November 2000
Theory: • Add appropriate theory from text or other sources.
Radar reflectivity factor where z is radar reflectivity factor (mm6/m3), Ni is the number of drops per unit volume (m-3) and Di is diameter (mm) for drops in the ith size category.
Rain Rate • Rain rate is the rate at which water volume accumulates over a unit area and is given by where A is the area involved and t is time. • This equation actually calculates the volume of water per unit area per unit time.
Liquid Water Content • Liquid water content is the mass of liquid water in a volume in space, given by where viis the terminal velocity of the ith diameter raindrop, and rw is the density of water.
Procedure: • Get Radar data during rain situation • Trace contours of reflectivity from each time onto a single image. • “Connect the dots” and draw swaths of the path of the storm at each reflectivity level. • Convert Z to R • Get rain at each time by integrating amount over each location at each time.
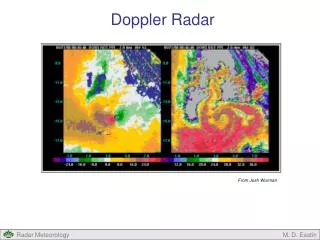
(Ex.) NEXRAD images of rain • Get data at hourly intervals. • One possible way is to get it from: • http://wxp.atms.purdue.edu/radar/previous/rad_comp-X.gif where X can be 1, 2, 3, 4, 5, or 6. • Alternatively, get more detailed data from a specific site.
Transfer Z data from each image to a common image. • Draw outlines of each reflectivity level onto a single piece of acetate or a separate image. • Then combine these.
Convert Z to R • Use Z-R relationship. • z = 300 R1.5 where R is rainrate in mm/h and z is radar reflectivity factor in mm6/m3
Draw new contours of R (parallel to the Z contours already on image)
Razzelfratz!!! • After spending an hour or so generating all the (ugly) images before this, it finally dawned on me that this is not necessarily going to answer the question: “How much did it rain at point X?” • How can we answer that question?
Questions: • Define “rainfall” • How do we go from radar data to rainfall accumulations? • What points (on the ground) are good ones to use? • How much time resolution in the radar data is needed? Does it depend on the kind of rain falling?
Rainfall total where R is the rainrate (mm/h) at a given place and time, Dt is the time interval between consecutive radar data sets. Rtotal = the total depth of rain at the location over the entire time interval.
How do we get R? • Radar give radar reflectivity factor Z (or z). • From a z-R relationship, we can convert z into R. • z = ARbwhere A and b are empirical constants, R is rainrate in mm/h, and z is the linear radar reflectivity factor in mm6/m3. • Use: z = 200R1.6, the Marshall-Palmer z-R relationship.