Download
1 / 9
90 likes | 202 Views
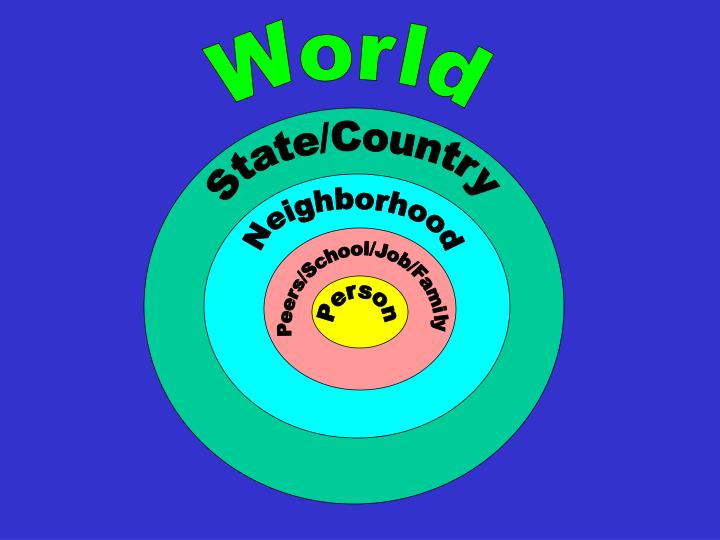
World. State/Country. Neighborhood. Peers/School/Job/Family. Person. Schooling. most developing countries have compulsory schooling most 12-13 year olds are in school regional differences majority of adolescent girls in sub-Saharan Africa not in secondary school

E N D
World State/Country Neighborhood Peers/School/Job/Family Person
Schooling • most developing countries have compulsory schooling • most 12-13 year olds are in school • regional differences • majority of adolescent girls in sub-Saharan Africa not in secondary school • large gender gaps in school enrollment • variations: urban, semi-urban, rural • policies, family expectations impact on girls’ schooling experiences
Every year of schooling increases a girl’s earning power by 10-20%Education/earning power associated with better health & nutrition, increased child survival, later age at marriage, and lower fertility
Texas & Mississippi had 74 births per 1,000 females 15-19 in 1996 D.C. had 102 births Massachusetts had 32 births state funding for FP ranges from $0-78 per female 15-19 funding for abortion varies by state 3/4 SBC prohibited from giving contraception few SBC in rural areas Accessible Services & Outcomes Vary: State by State
Savage Inequalities? • Student:guidance counselor ratio GWHS 1996: 1:1,666 • Computers GWHS per 1,000: 4.5 • Computers Stuyvesant HS per 1,000: 8.0 • Computers NYS suburbs per 1,000: 12.8