Download
1 / 42
620 likes | 1.18k Views
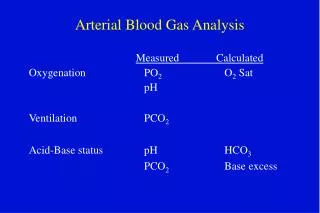
Blood Gas Analysis. Carrie George, MD Pediatric Critical Care Medicine Adapted from Dr. Lara Nelson. Blood Gas Analysis. Acid-base status Oxygenation. Anatomy of a Blood Gas. pH/pCO 2 /pO 2 /HCO 3. Base: metabolic. Oxygenation: lungs/ECMO. Acid: lungs/ECMO.

E N D
Blood Gas Analysis Carrie George, MD Pediatric Critical Care Medicine Adapted from Dr. Lara Nelson
Blood Gas Analysis • Acid-base status • Oxygenation
Anatomy of a Blood Gas • pH/pCO2/pO2/HCO3 Base: metabolic Oxygenation: lungs/ECMO Acid: lungs/ECMO The sum total of the acid/base balance, on a log scale (pH=-log[H+])
Blood Gas Analysis • Determine if pH is acidotic or alkalotic • Determine cause: • Respiratory • Metabolic • Mixed 3. Check oxygenation
Acid-Base Regulation • Three mechanisms to maintain pH • Respiratory (CO2) • Buffer (in the blood: carbonic acid/bicarbonate, phosphate buffers, Hgb) • Renal (HCO3-)
Acid-Base Equation: the carbonic acid/bicarbonate CO2 + H2O H2CO3 HCO3- + H+ Respiratory component Blood/renal component Acid Base
Acid vs. Alkaline Blood pH • Arterial pH = 7.40 • Venous pH = 7.35 6.9 7.0 7.4 7.5 Acidosis Neutral pH Alkalosis
Etiology • Respiratory • Metabolic • Mixed
Rule #1 • Every change in CO2 of 10 mEq/L causes pH to change by 0.08 (or Δ1 = 0.007) • Increased CO2 causes a decreases in pH • Decreased CO2 causes an increase in pH
Respiratory Acidosis • Hypercarbia from hypoventilation • Findings: • pCO2 increased therefore… pH decreases • Example: ABG : 7.32/50/ /25
Respiratory Alkalosis • Hypercarbia from hypoventilation • Findings: • pCO2 decreased… therefore pH increases • Example: ABG – 7.45/32/ /25
Metabolic Changes • Remember normal HCO3- is 22-26
Rule #2 • Every change in HCO3- of 10 mEq/L causes pH to change by 0.15 • Increased HCO3- causes an increase in pH • Decreased HCO3- causes a decrease in pH
Metabolic Acidosis • Gain of acid – e.g. lactic acidosis • Inability to excrete acid – e.g. renal tubular acidosis • Loss of base – e.g. diarrhea • Example: • ABG – 7.25/40/ /15
Metabolic Alkalosis • Loss of acid – e.g. vomiting (low Cl and kidney retains HCO3-) • Gain of base – e.g. contraction alkalosis (lasix) • Example: • ABG – 7.55/40/ /35
Mixed • pH depends on the type, severity, and acuity of each disorder • Over-correction of the pH does not occur
Practical Application • Check pH • Check pCO2 • Remember Rule #1 Every change in CO2 of 10 mEq/L causes pH to change by 0.08
Practical Application cont. 4. Does this fully explain the results? 5. If not, remember Rule #2 Every change in HCO3- of 10 mEq/L causes pH to change by 0.15
Example #1 • ABG- 7.30/48/ /22 • Acidotic or Alkalotic? • pCO2 High or Low? • pH change = pCO2 change? Combined respiratory and metabolic acidosis
Example #2 • ABG- 7.42/50/ /32 • Acidotic or Alkalotic? • pCO2 High or Low? • pH change = pCO2 change? Metabolic alkalosis with respiratory compensation
Oxygen Supply and Demand Arterial oxygen depends on: -Lungs ability to get O2 into the blood -Ability of hemoglobin to hold enough O2
Bedside Questions of Oxygenation • Does supply of O2 equal demand? • Is O2 content optimal? • Is delivery of O2 optimal?
Mixed Venous Saturation SvO2: What is it? -In simple terms, it is the O2 saturation of the blood returning to the right side of the heart - This reflects the amount of O2 left after the tissues remove what they need SvO2 = O2 delivered to tissues – O2 consumption
Oxygen Delivery O2 transport to the tissues equals arterial O2 content x cardiac output -DO2 = CaO2 x CO - Normal DO2 = 1000 ml/min
Arterial Oxygen Content • CaO2 = (1.34 x Hgb x SaO2) + (PaO2 x 0.0031) • Normal CaO2 = 14 +/- 1 ml/ dl • Example: CaO2 = (1.34 x 10 x 95)+(78 x 0.0031) = 12.97 If Hgb is 12, CaO2 = 15.52 If PaO22 is 150, CaO2 = 13.20
Mixed Venous Oxygen Content • CvO2 = (1.34 x Hgb x SvO2) + (PvO2 x 0.0031) • Normal CvO2 = 14 +/- 1 ml/dl
Oxygen Consumption • VO2 = (CaO2 – CvO2) x CO Fick equation • Normal VO2 = 131 +/- 2 ml/min
Mixed Venous Saturation SvO2 = O2 delivered to tissues – O2 consumption How do we know what it is? - Calculate it - Direct blood gas analysis, e.g. from a pulmonary catheter - Oximetry
Normal Mixed Venous Saturation • Normal value -68%-77% -Change from arterial saturation of 20% to 30% • Values less than 50% are worrisome, or a change of 40%- 50% • Values less than 30% suggest anaerobic metabolism • The most useful application is to follow trends
Oxygen Saturation and pO2 • An O2 saturation of 75% correlates with a PaO2 of about 45 mmHg • This is on the step portion of the oxygen dissociation curve
Utility of MVO2 • Gives information about the adequacy of oxygen delivery • Suggests information about oxygen consumption • Can help determine the usefulness of clinical interventions
Decreased MVO2 Oxygen delivery is not high enough to meet tissue needs. • Poor saturation • Anemia • Poor CO • Increased tissue extraction
Increased MVO2 • Wedged PA catheter • Improvement in previous poor situation • Shunting -Tissues no longer extracting oxygen -How can you tell?
End-Organ Perfusion • Brain - Neurologic exam • Kidneys -Urine output - Creatinine • Lacitic acidosis
NIRS • Near Infrared Regional Spectroscopy • An alternative strategy for measuring localized perfusion
How the INVOS System Works • rSo2 index represents the balance of site-specific O2 delivery and consumption • It measures both venous (~75%) and arterial (~25%) blood • Indicates adequacy of site-specific tissue perfusion in real-time • Correlates positively with SvO2, but is site-specific and noninvasive • rSO2 is not a simple blood gas, it measures the amount of oxyhemoglobin in the tissue
Cerebral rSO2 • Normal values: - 30% less than the arterial saturation - Even in cyanotic heart disease this is true • Concentrating values : - A change of 20% from baseline - rSO2 < 60% • As with MVO2 trends are the most helpful application
Peri-Renal rSO2 • Normal Values: - 10%-15% less than the arterial saturation - Even in cyanotic heart disease this is true • Concerning values: - A change of 20% from baseline -rSO2 < 60% • As with MVO2 trends are the most helpful application
Why Monitor Both? • More information is always better • Perfusion is differentially distributed, i.e. generally cerebral blood flow is maintained at the expense of other organs