Download
1 / 37
370 likes | 519 Views
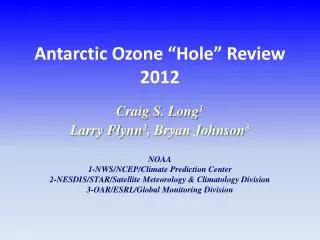
Antarctic Ozone “Hole” Review 2012. Craig S. Long 1 Larry Flynn 2 , Bryan Johnson 3 NOAA 1-NWS/NCEP/Climate Prediction Center 2-NESDIS/STAR/Satellite Meteorology & Climatology Division 3-OAR/ESRL/Global Monitoring Division. Outline. Quick ozone review Ozone generation cycle

E N D
Antarctic Ozone “Hole” Review2012 Craig S. Long1 Larry Flynn2, Bryan Johnson3 NOAA 1-NWS/NCEP/Climate Prediction Center 2-NESDIS/STAR/Satellite Meteorology & Climatology Division 3-OAR/ESRL/Global Monitoring Division
Outline • Quick ozone review • Ozone generation cycle • Ozone depletion cycles • Ozone recovery expectations • NOAA-centric perspective • 2012 ozone “hole” in context of 32 previous years • Various ways to monitor and measure ozone “hole” • Meteorological conditions accountable for 2012 ozone size and longevity
Ozone Destruction Cycle From 2010 Ozone Assessment
Reservoir molecules DeNitrification Activation
Why Ozone Holes form over Antarctica and Not the Arctic From 2010 Ozone Assessment
Ozone Recovery Protocols From 2010 Ozone Assessment
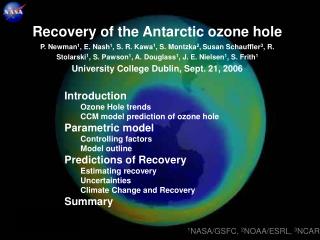
Ozone Recovery Expectations From 2010 Ozone Assessment
Ozone Recovery Expectations From 2010 Ozone Assessment
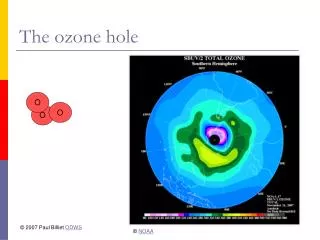
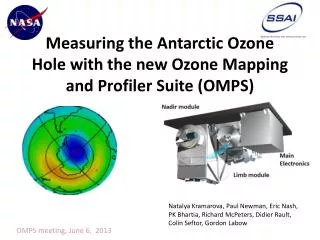
2012 Antarctic Ozone “Hole” • Ozone “Hole” definition: • Area in which total column ozone is less than 220 DU • Satellite Perspective • South Pole Perspective
Ozone “Hole” Annual Maximum Size Using SBUV/2 v8 analyses
South Pole Ozonesonde Measurements Comparison of 2012 with 2006 which had near complete ozone depletion
South Pole Spectrophotometer Measurements Late October By late October the break down of the polar vortex lead to the early end of the 2012 ozone “hole” resulting in anomalously high total ozone values.
Meteorological Conditions • PSC Area • Defines the potential size of ozone depleted air • Vortex Area • Separates cold/ozone depleted polar air from ozone rich warmer mid-latitude air • Defines longevity of ozone hole • What modulates these: • Wave activity and heat flux from mid-latitudes
Vortex, Temperature, Ozone Relationship Note how the polar vortex separates the ozone rich middle latitudes from the depleted ozone values inside. Note how the high ozone values coincide with the warm temperatures surrounding the polar vortex.
SH Polar Temperatues 50hPa SH high latitude temperatures were warm than last year and near the long term average during the SH winter/spring months. The temps raise rapidly in October due to the early vortex breakdown. 2hPa SH high latitude temperatures were consistently warm during the SH winter/spring months.
Volume of Cold Air 2012 2006 Compared to a year (2006) with a large ozone hole, the PSC area at various levels in 2012 were much smaller.
Comparison of 2012 PSC Area with Previous Years Zonal Mean Temperature Anomaly
SH Poleward Heat Flux Heat flux activity showed several pulses in 2012 which raised temperatures and decreased the size of the PSC area/volume. The strong pulse in mid October lead to the vortex break-down and filling in of the ozone hole.
Jul/Aug 100mb Heat Flux vs Aug/Sep 50mb Temps 2012 50 hPa Temperature Heat Flux [v’T’] (deg m sec-1)
Comparison of Heat Flux/Temp Relationship between MERRA and CFSR 50 hPa Temperature Heat Flux [v’T’] (deg m sec-1)
Heat Flux Impacts on Polar Temperatures Wave 1 and 2 activity transports heat towards polar region. Increases the temperature in the polar vortex. Shrinks the area of PSCs.
Role of QBO Descending easterlies
Descending Easterlies BD Circulation Speeds Up Low Tropical Ozone High Polar Ozone High Polar Ozone
Low Ozone in Tropics, High in Extra-tropics and South Polar Region
Summary • SH Polar temperatures were warm • Heat Flux activity was great • PSC area was small • Ozone Hole size is extremely small • Wave activity and temperatures don’t necessarily explain why the ozone hole size was so small. • South Pole ozonesondes imply ozone levels were well above normal. • Perhaps ozone depletion was equivalent to other years yet due to higher starting point the area below 240 DU threshold was smaller than those same years. • Strong wave activity in Oct resulted in early end of ozone hole