Download
1 / 38
410 likes | 668 Views
Topography of the Earth. Aim: How is Earth’s topography represented on a map?. Objectives:. Read topographic maps Determine elevation and gradients on the map Create your own topographic map. Vocabulary:. Topography Contour Lines Contour Interval Slope Gradient Depression Altitude

E N D
Topography of the Earth Aim: How is Earth’s topography represented on a map?
Objectives: • Read topographic maps • Determine elevation and gradients on the map • Create your own topographic map
Vocabulary: • Topography • Contour Lines • Contour Interval • Slope • Gradient • Depression • Altitude • Elevation • River
A. Topography is…. The shape of the land (flat, sloping, hilly, mountainous)
B. Some more definitions… • Contour line: A line that connects areas of equal elevation on a map • Contour interval: the difference between one contour line and the next. To find the contour interval, subtract the two values given,and then divide by the number of lines you need to go from one value to the next. • Slope: the angle of the land. The closer the contour lines are on a map, the steeper the slope • Contour Gradient or Elevation Gradient: the rate at which the slope of land changes. The gradient can be either steep or gradual. • Gradient = change in elevation distance
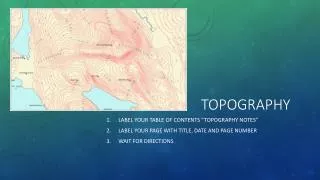
B. More definitions continued… • Depression: This symbol is used to show where the elevation goes down, like a hole. • River: a river is usually shown by a wrinkle or bump in the contour lines • Relief: The difference between the highest and lowest point of a fixed area • Landform: geographical feature of an area
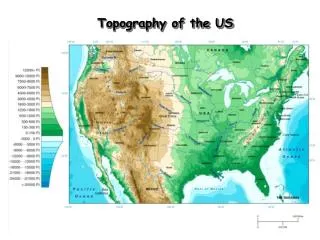
C. Factors that determine topography: a. Elevation -the height above sea level (altitude) b. Relief -the difference in elevation between the highest and lowest parts of an area c. Landforms - A feature that is formed by processes that shape the Earth (i.e. weathering, erosion, deposition, tectonic plate movements)
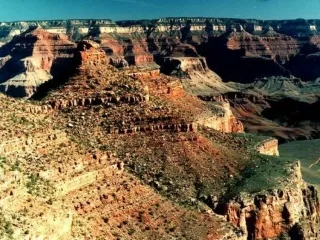
D. Types of Landforms a. Plain – low flat land, low relief b. Mountain – high elevation, high relief c. Plateau – high elevation, low relief
Virtual Contour Maps • http://www.classzone.com/books/earth_science/terc/content/investigations/es0307/es0307page01.cfm
Let’s keep going! 100m
Now we’re at 200m. 200m 100m
Shall we march on? 200m 100m
We’ve made it to 300m! 300m 200m 100m
On to the peak! 300m 200m 100m
We’re on the peak, but what’s our elevation? 300m 200m 100m
Any ideas? Let’sadd contour lines for every 50 meters and see if that helps. 300m 200m 100m
We know that we are above 350m, but less than 400m. 350m 300m 250m 200m 150m 100m 50m
Let’s head down the hill, it’s getting late! 350m 300m 250m 200m 150m 100m 50m
Now what’s our elevation? If you said somewhere between 200m and 250m you are right! 350m 300m 250m 200m 150m 100m 50m
Let’s try this again! 350m 300m 250m 200m 150m 100m 50m
What’s our elevation now? If you said 50m or just under, you’re right! 350m 300m 250m 200m 150m 100m 50m
If you said more than 150 meters, but less than 200 meters your right!
Think you know our elevation now? More than 300meters But less than 350meters
If we were standing on the peak, what would be our elevation? • More than 350 meters, less than 400 meters
More than 100 meters, less than 150 meters
Figure 1: Highest elevation =Contour Interval = Elevation of the outermost line =
The contour interval is ___________________ • 2. Which direction does the river flow? ________________ • 3. Elevation of points: • A ______ B ______ C ________ D ______ X ______
Figure 2… B E C A D