Download
1 / 16
160 likes | 281 Views
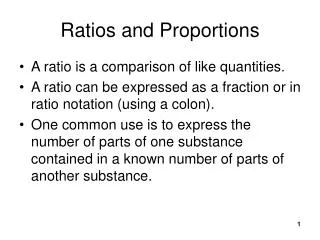
Ratios and Proportions. A Common Core Unit of Study in Math. North Park Zoo. You have been named as the new manager of the North Park Zoo. As manager, you are responsible for all the tasks necessary to keep the zoo running smoothly.

E N D
Ratios and Proportions A Common Core Unit of Study in Math
North Park Zoo • You have been named as the new manager of the North Park Zoo. • As manager, you are responsible for all the tasks necessary to keep the zoo running smoothly. • However, you would like to expand the size of the zoo to increase attendance and revenue for the zoo.
Your Task • You will create a presentation to secure a loan from your local bank to increase the size of the zoo. • Your presentation will detail the attendance of the zoo over time, the number of animals living at the zoo, and the costs involved in the feeding of the animals.
Your Task continued • You will need to present the most current information for the zoo, as well as projected increases following the zoo expansion. • The presentation should include a brochure to be handed out, a current map of the zoo, plus a blueprint of your new zoo layout, and a power point presentation that will explain the benefits to expanding the zoo. Remember to include the scale of your drawing.
Your Goal • Successfully persuade the bank manager to approve the loan to expand the zoo, so be as detailed as possible!
Task 1 – Animal Population • Using a chart, identify the animals living in the zoo. • You will need to list each animal type living in the zoo, the percentage each animal type represents and how many of each animal will be represented by the percentage. • Make a second chart showing a 20% increase in animals.
Pie Chart to show Percentages and Populations for Animal Population
Task 2 – Feeding Analysis • Research the number of pounds of food eaten by each type of animal per day. • Using that information, design a table explaining how many pounds of food are needed to feed each animal type daily, weekly, monthly, and annually.
Feeding Analysis Please note the amounts used here are just random numbers used for demonstration. They do NOT represent the result of any research on what the animals eat. I can’t make it too easy for you. F
Task 3 – Food Costs • Using the information from Task 2, determine the cost per pound of food necessary to feed each type of animal. • Then, determine the total cost per day, week, month, and year. • If your animal population increases by 20%, figure out the increased cost to feed the animals.
Please note the amounts used here are just random numbers used for demonstration. They do NOT represent the result of any research on the cost of the food for the animals. I can’t make it too easy for you. ;-) Food Costs
Task 4 - Attendance • Determine the average attendance of your zoo per day for both adults and children. • Based on this, use a table to determine the weekly, monthly, and annual attendance for both adults and children. • Use the current ticket price for adults and children to determine revenue on a daily, weekly, monthly, and annual cycle. • You plan to increase attendance by 40% with the expansion. Determine the increase in revenue.
Average Attendance Please note the amounts used here are just random numbers used for demonstration. They do NOT represent the result of any research on what the average attendance/ticket price is at zoos. I can’t make it too easy for you. F
Task 5 – Final Presentation • Create a brochure and map of your current zoo. • Create a blueprint to show the 20% expansion. • Create a power point presentation that explains the benefits of expanding the zoo. • Be sure to use the tables and charts created in earlier tasks in your slide show.