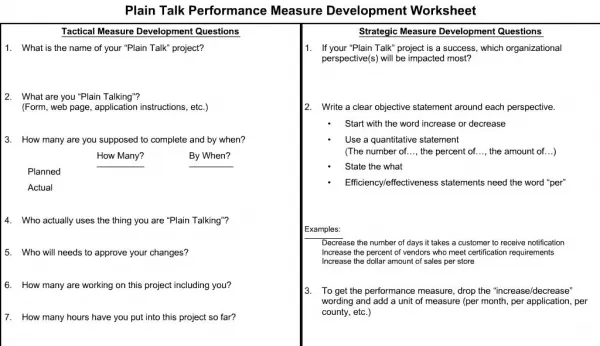
Download
1 / 15
150 likes | 298 Views
Performance Measure. Leftover Paint in MN. Example of Performance Goals. Methodological Example using findings of Infrastructure Report and MN system This data analysis is not complete, so actual numbers will be a bit different

E N D
Performance Measure Leftover Paint in MN
Example of Performance Goals • Methodological Example using findings of Infrastructure Report and MN system • This data analysis is not complete, so actual numbers will be a bit different • After Infrastructure Example a general approach to establishing goals • Other goals needed for correct purchasing awareness, reuse (diversion of leftover paint), education, awareness, etc.
Existing MN HHW Collection System 57 Collection Facilities in 87 Counties
From Infrastructure Report • Paint Sales ≈ 2.3 gals/person/yr. • Leftover paint best est. is 10% of sales (with range of 5-15%) • Target Collection Goals range from 25-75% OR, expressed as percent of sales 2.5% (low), 5.0% (med.), 7.5% (high), 10% (extra high) • Some local and state/provincial areas are already collecting in the med. to high range
Example Goals in gallons/person/yr Low (2.5%) = 0.06 gallons/person Med (5.0%) = 0.11 “ “ High (7.5%) = 0.17 “ “ Ex. High (10%) = 0.23 “ “ Actual Current Program Performance Quebec = 0.06 gal/pr Portland = 0.09 “ “ British Col. = 0.13 “ “ WA State = 0.12 “ “ Hennepin Co. MN = 0.13 gal/person/yr Collection Measures
Service Levels vary by Pop. Density • Urban Areas can serve more people per site but typically max out at 100k-200k people per collection site. • Rural areas need coverage, with a need for collection sites in each small population centers with ≈± 20k people • Less densely populated areas probably served by occasional collection events.
Summary of MN Infrastructure Needs • Underserved urban areas need perhaps 7-15 additional collection points in 5 counties • Some Rural counties above or near 20k pop. probably need at least one paint collection site
MN Population 5.1 M Size = 87k sq. mi. Existing Collection sites = 57 Likely need 20 – 30 more collection sites (preliminary data only, probably will change +/-) BC Population 4.3 M Size = 357k sq. mi. Existing Collection sites = 103 A few collection events per year in very rural areas MN vs. British Columbia
State-by-State Performance Goals Timeline State start date (month & year) Initial service levels in place 5 year performance goals 10 year performance goals 12 months 60 more months (72 months from start) 120 more months (192 months from start) Establishing Goals State-by-State
Goals Concept • Initial Service Level would after 12 mo. include: • Supplemental Infrastructure • Collection Points • Recycling Assets/contracts • Transportation Assets/contracts • Supplemental Education/Outreach • Reuse and Reduction Campaign rolled out • Retailers and Governments actively promoting reuse, reduction as well as promotion of purchasing recycled paint • Tracking and Accountability coordinated by PSO
MN Performance Collection Goals Timeline Start January 2008 Initial service levels in place 5 year performance goals 10 year performance goals 12 months 60 more months (72 months from start) 120 more months (192 months from start) Existing Collection Level = 5% Initial Service Level Goal = 6.5% 5 Yr. Service Level Goal = 8.0% 10 yr. Service Level Goal = 9.5 % Example MN Collection Goals