Download
1 / 53
530 likes | 675 Views
Derek Buzasi Univ. of Washington & Eureka Scientific. The Little Satellite that Could. Introduction. “X-ray vision” for stars A brief history of WIRE Some Closeups Altair Polaris Alpha Cir Procyon Eclipsing Binaries Future Prospects.

E N D
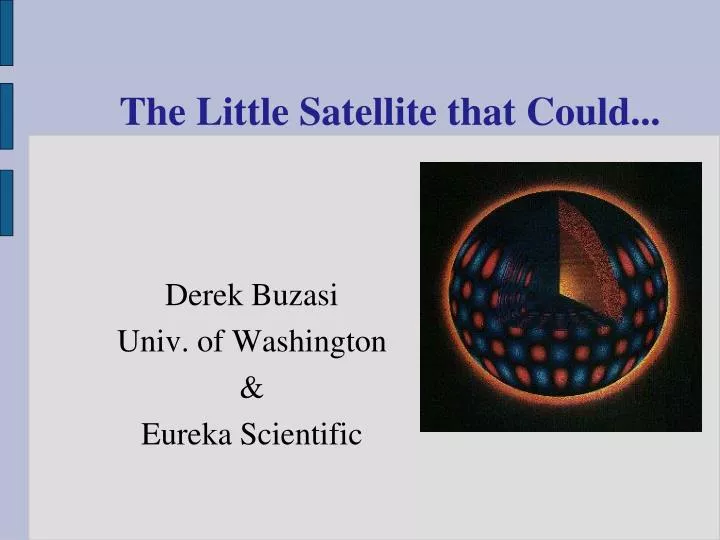
Derek Buzasi Univ. of Washington & Eureka Scientific The Little Satellite that Could...
Introduction • “X-ray vision” for stars • A brief history of WIRE • Some Closeups • Altair • Polaris • Alpha Cir • Procyon • Eclipsing Binaries • Future Prospects
How do we know anything about the internal structure of the Sun?
Coherent motions on the solar surface • Leighton (1960) uses Doppler effect to observe oscillatory motion on the Sun • Amplitudes are ~hundreds of meters/sec • Periods are ~5 min (~3 mHz)
What are these things? • They appear to be acoustic waves traveling in a cavity • The Sun is ringing like a bell • The study of these waves is called “helioseismology”
Each unique way in which the Sun can oscillate is called a “mode”
OK – so what good is all this? (Some real physics at last!) Each mode has a frequency which is characteristic of some “average” sound speed along its travel path • “Low degree” modes penetrate deeply • “High degree” modes sample only the surface By using information from all of the modes, we can model the inside of the Sun! Good news! There are more than a million modes Bad news! There are more than a million modes
It would be nice to do this for stars, too… • Unfortunately, asteroseismology is much more difficult • Less light (and atmospheric interference) • Unresolved sources • But astronomers are trying!
A little about stars… • What we’d like to know • mass, age, composition, rotation rate, internal structure, activity, etc. • Ways to find out • cluster stars (common origin) • binary stars (interact via gravity) • field stars (help!) • Wider applications? • distance scale, nucleosynthesis, etc.
Hertzsprung-Russell (HR) Diagram Remember this?
Technical Approaches to Asteroseismology Two Basic Approaches 1. Look for tiny Doppler shifts (~10 cm/s, or parts per billion) in spectral lines from the ground, where we have big telescopes. 2. Look for tiny variations (parts per million) in the stellar luminosity from space, where the atmosphere isn’t a problem.
Other Uses for ultra-high-precision photometry • Rotational Modulation • Granulation (surface signature of convection) • Eclipses & transits
WIRE = Wide-Field Infrared Explorer 1994: Selected by NASA; IR mission designed to study extragalactic star formation for 4 mos 1999: Pegasus launch on 4 Mar 1999 1999: Primary mission failure on 8 Mar 1999 1999: Conversion to asteroseismology mission begins 30 Apr 1999 May 1999 – Sept 2000: Epoch 1 Dec 2003 – 23 Oct 2006: Epoch 2 Launched 4 Mar 1999; failed 8 Mar 1999
The Star Tracker • Ball Aerospace CT-601 • 52 mm aperture • 512 512 SITe CCD • 7.8° 7.8° field (1 arcmin/pixel) • 16-bit ADC • Gain 15e-/ADU
Epoch I • Original mission was 30 April 1999 - 30 September 2000 • 28 asteroseismology targets; 10 additional targets • Primary targets only • Mission termination due to lack of funding
Epoch II • Mission restart • New flight software included field rotation, making secondary targets usable
Selected Accomplishments • Altair • What don’t we know about the brightest star in the northern sky? • Polaris • New insights into an old favorite • Alpha Cir • Interaction of rotation and oscillations • Procyon • Granulation in a solar-like star • Eclipsing Binaries • Old wine in new bottles
Altair • Brightest star in the northern sky • Part of the “summer triangle” • Sometimes used as a flux standard! • WIRE observed for 22 days...
Each “frame” represents a 2-day window Overall envelope of variability is ~2 ppt
Altair is the brightest δ Scuti star! Largest peak is at 15.768 d-1; amplitude 0.42 mmag Frequency units are “cycles/day” – 15.76 c/d corresponds to roughly 1.5 hours.
9 total modes detected; f1 is easily identified as the fundamental but other IDs are less clear due to the extremely rapid rotation of the star. HR diagram showing selected models. The two evolutionary tracks depicted correspond to 1.70 solar masses and v = 150 km/s (solid line), and 1.75 solar masses and v = 200 km/s (dashed line). Ages in the shaded area range from 500 to 750 Myr The cross indicates observations.
Polaris • “North Star” • Closest and brightest Cepheid • Amplitude has been dropping for decades • No longer detectable as variable from the ground • Observed simultaneously using multiple telescopes • WIRE • SMEI • AST
Oscillation timing is changing: stellar evolution in real time!
Alpha Circinis • Member of class rapidly oscillating peculiar A-type (roAp) stars • First detected in 1970s with ground-based telescopes • Typical periods are a few minutes • Typical amplitudes are a few parts per thousand or less • Alpha Cir has one well-known mode, with a frequency of 2442 mHz
Procyon • F5 IV (V ~ 0, so one of the brightest stars in the sky) • Historically considered one of the best possible stellar targets for asteroseismology • Higher mass, more evolved star is expected to have larger oscillation amplitudes based on theory • WIRE analysis by Bruntt, Kjeldsen, Buzasi, Bedding • Two time series totalling ~19 days
The light curves of Procyon as seen from WIRE in September 1999 (top) and September 2000 (bottom). Data affected by scattered light have been removed and the correlation with FWHM has been removed. In each panel, only every fifth data point is plotted.
Comparisons: WIRE x 2, MOST, Solar The excess power in the MOST data appears to be due to an as yet not understood noise source. The plot shows the smoothed power density spectrum for each data set. PDSs permit direct comparison of different time series, since they take into account the different lengths and resolutions of the data sets. The VIRGO data represent the solar PDS as viewed from space. Note that hydrodynamic models predict Procyon to have somewhat greater granulation “noise” than the Sun does.
The four panels show the power density spectrum of the WIRE 2000 time series along with different simulations. Each simulation is the mean of five simulations with different seed numbers. The hatched regions show the 1-σ variation for selected simulations. Simulations have timescales of the granulation of 250, 750, and 1250 s. Simulations for two different white noise levels The granulation timescale and granulation PDs are 750 s and 18 ppm2/ µHz, while the amplitude of the p-modes are 5, 10, 15 ppm. The timescale of the granulation is 750 s but the granulation power densities (PDs) are 10, 18, and 64 ppm2/ µHz.
WIRE 1999 and 2000 results: Procyon WIRE spectra are marked by open box symbols Best-fit models The 1-σ variation of the simulations is shown by the hatched region.
Eclipsing Binaries A classic astronomer’s tool • Orbital timing gives stellar masses • Lengths of eclipses give relative stellar radii • Depths of eclipses give relative stellar temperatures • Shapes of eclipse light curves give atmospheric structure
Where do we go from here? • The future of asteroseismology lies in space!


![[READ DOWNLOAD] The Easy-to-Read Little Engine that Could (The Little Engine That Could)](https://cdn7.slideserve.com/12424515/slide1-dt.jpg)
![get [PDF] Download The Little Engine That Could (Original Classic Edition)](https://cdn7.slideserve.com/12424519/slide1-dt.jpg)
![Download Book [PDF] The Easy-to-Read Little Engine that Could (The Little Engine That Could)](https://cdn7.slideserve.com/12431894/slide1-dt.jpg)