Download
1 / 20
200 likes | 1.49k Views
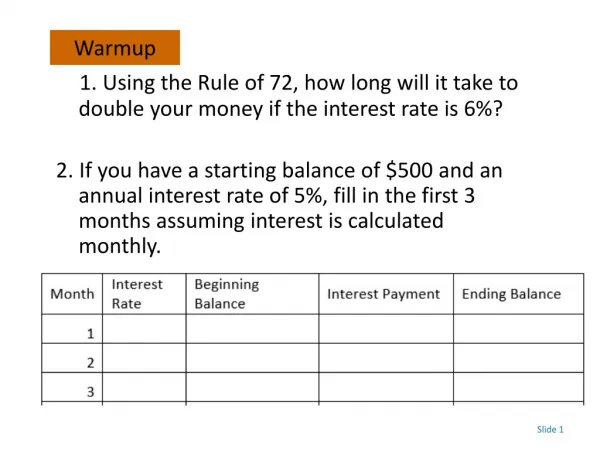
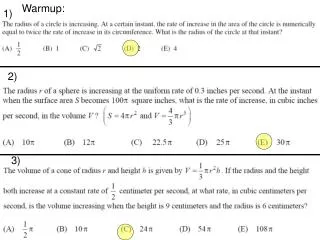
Warmup NO CALCULATORS. Convert into radians or degrees. Find the exact value of:. Nice job. Now try these. Solve for θ , where. Solve for θ. Problems in this column return MORE THAN ONE answer because asking what angle rotation would result in the given trig values.

E N D
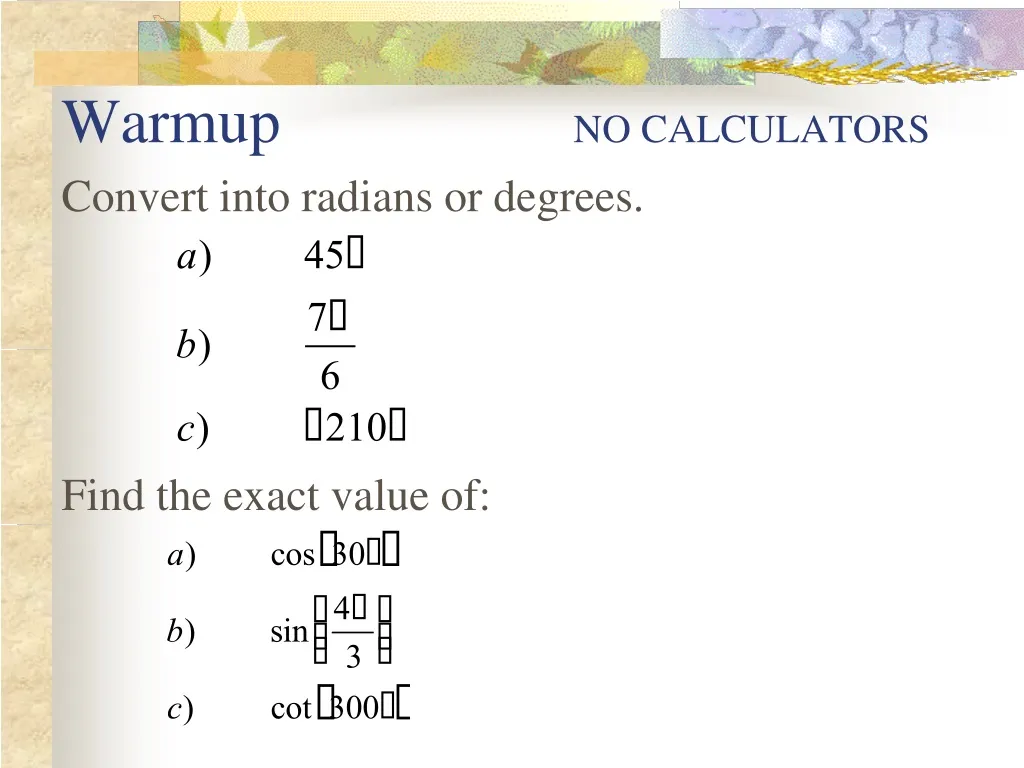
Warmup NO CALCULATORS Convert into radians or degrees. Find the exact value of:
Nice job. Now try these . . . Solve for θ, where Solve for θ. Problems in this column return MORE THAN ONE answer because asking what angle rotation would result in the given trig values. Problems in this column return ONE answer because asking for output of inverse trig FUNCTION
Pre-Calculus Unit 8 Day 4 Polar Coordinates An alternative way to plot points!
The Polar Express First we start with the POLE or ORIGIN Then we extend a ray to the right. This is called the POLAR AXIS
r q Getting to the point… The location of a point “P” is specified by: • Distance from the pole: r • Angle measure relative to the polar axis: P
P r q Compare Cartesian Polar (x,y) • x = how far to go left or right • y = how far to go up or down. (r, q) • r = distance from pole (radius) • q = the angle the radius makes • with the polar axis P y x
Cartesian vs Polar • Cartesian Coordinate System • A point is named by a unique ordered pair (x,y) • Polar Coordinate System • A point can be named by many different ordered pairs (r, q) • Polar points are NOT unique!
Together let’s plot the following polar points. Plot AND label all 4 points on the same grid. (Use the grids in the back of the packet!) NOTE the scale!!!
Together let’s plot the following polar points. Plot AND label all 4 points on the same grid. (Use the grids in the back of the packet!) NOTE the scale!!!
Cartesian Coordinates Single variable equations are special cases Vertical line Horizontal line
With Polar Coordinates What happens when either r or q is a constant? r = a q = b a b Regardless of Distance from the Pole (r) the Angle of Rotation () is constant Regardless of Angle of Rotation () the Distance From the Pole (r) is constant
Plotting a Polar Equation using a Table of Values Hint: r = 8 sin q ≈
Example of a Polar Equation r = 8 sin q
Now continue on to 2p r = 8 sin q
Looking at our two sets of data points . . . r = 8 sin q The second set of plotted points are NOT new points! Why do you think this happens?
Let’s explore the next problems using the calculator . . . • Polar Mode • 2nd Format PolarGC • For this problem set the window: • θmin=0, θmax=2π, θstep=π/12 • xmin=-2, xmax=3, xscl=1 • ymin=-2, ymax=2, yscl=1
Now for the equation . . . When do the points start repeating?
One more . . . . To smooth out the curve make the θstep smaller. θstep=0.1 When do the points start repeating?
Last One . . . Adjust your window to get the graph to fit. When do the points start repeating?