Download
1 / 33
330 likes | 349 Views
This study presents the analysis of mid-rapidity charged-particle multiplicity and its centrality dependence in Au+Au collisions at energies of 19.6 and 200 GeV. The research compares the experimental results with theoretical predictions, emphasizing consistent centrality determinations and the "Vertex Tracklets" multiplicity analysis technique utilized to reduce systematic uncertainties.

E N D
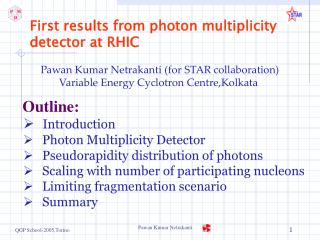
http://xxx.lanl.gov/nucl-ex/0405027 Collision geometry scaling of Au+Au pseudorapidity density from √sNN = 19.6 to 200 GeV Aneta Iordanova University of Illinois at Chicago For the collaboration
Outline • Overview • Analysis Technique • Centrality determination • Tracklet reconstruction method • Results • Conclusions
Collaboration Birger Back,Mark Baker, Maarten Ballintijn, Donald Barton, Russell Betts, Abigail Bickley, Richard Bindel, Wit Busza (Spokesperson), Alan Carroll, Zhengwei Chai, Patrick Decowski, Edmundo García, Tomasz Gburek, Nigel George, Kristjan Gulbrandsen, Clive Halliwell, Joshua Hamblen, Adam Harrington, Michael Hauer, Conor Henderson, David Hofman, Richard Hollis, Roman Hołyński, Burt Holzman, Aneta Iordanova, Jay Kane, Nazim Khan, Piotr Kulinich, Chia Ming Kuo, Willis Lin, Steven Manly, Alice Mignerey, Gerrit van Nieuwenhuizen, Rachid Nouicer, Andrzej Olszewski, Robert Pak, Inkyu Park, Heinz Pernegger, Corey Reed, Michael Reuter, Christof Roland, Gunther Roland, Joe Sagerer, Helen Seals, Iouri Sedykh, Wojtek Skulski, Chadd Smith, Maciej Stankiewicz, Peter Steinberg, George Stephans, Andrei Sukhanov, Marguerite Belt Tonjes, Adam Trzupek, Carla Vale, Sergei Vaurynovich, Robin Verdier, Gábor Veres, Peter Walters, Edward Wenger, Frank Wolfs, Barbara Wosiek, Krzysztof Woźniak, Alan Wuosmaa, Bolek Wysłouch ARGONNE NATIONAL LABORATORY BROOKHAVEN NATIONAL LABORATORY INSTITUTE OF NUCLEAR PHYSICS PAN, KRAKOW MASSACHUSETTS INSTITUTE OF TECHNOLOGY NATIONAL CENTRAL UNIVERSITY, TAIWAN UNIVERSITY OF ILLINOIS AT CHICAGO UNIVERSITY OF MARYLAND UNIVERSITY OF ROCHESTER
Overview • Measure the mid-rapidity charged-particle multiplicity and its centrality dependence for 19.6 and 200GeV • Compare the results with model predictions • Consistent centrality determinations for the two data sets • ‘Vertex Tracklets’ multiplicity analysis technique is used in order to reduce the systematic uncertainties
Centrality Determinationat 200 GeV Paddle Counters at 3.2 < |η| < 4.5 • Summed Paddle Signals • ‘Paddle Mean’ • Zero Degree Calorimeter Energy (at ±18 m – not shown) • Observe monotonic anti-correlation of PdlMean with ZDC Energy (number of spectator neutrons) for central data Central 50% 200GeV Au+Au ZDC Sum (a.u.) Paddle Mean (a.u.)
Centrality Determinationat 200 GeV • PdlMean also monotonic with Npart from MC simulations • With this information • Estimate the trigger efficiency (from Data and MC) • Divide data into bins of inelastic cross-section Npart Paddle Mean (a.u.) Entries Paddle Mean (a.u.)
Centrality Determinationat 200 GeV • Measured pseudorapidity distributions • Paddles coverage relatively ‘different’ region in h for 19.6 than 200GeV
Centrality Determinationat 19.6 GeV • Summed Paddle Signal • No longer monotonic • Need a new signal • Summed charge deposited in Octagon • Monotonic • with spectators (Data) • with Npart (MC) ZDC Sum (a.u.) Paddle Mean (a.u.) ZDC Sum (a.u.) Summed Charge in Octagon (a.u.)
Centrality Measures • Centrality defined at 200 and 19.6GeV • Not exactly the same • 200GeV → away from mid-rapidity • 19.6GeV → at mid-rapidity • Does this matter? • From our d+Au experience it could be critical
Matched Centrality Measures • Select the “same” regions at 200 and 19.6 GeV • Now have two centrality methods at each energy • One at mid-rapidity • One away from mid-rapidity • Mechanism for comparing ‘like’ regions to see systematic effects Regions are ‘matched’ according to the ratio of beam rapidities (a) with (c) (b) with (d)
Y 1 channel X Top f Beam pipe Z, h Inner Layer Bottom Outer Layer 50.4mm 62.1mm Vertex Detector • 8192 silicon channels • Outer Layer: 2 × 2048 channels, 0.47mm × 24.1mm • Inner Layer: 2 × 2048 channels, 0.47mm × 12.0mm
Tracklet Two-hit combinations from Outer and Inner Vertex (Top or Bottom), pointing to the reconstructed vertex. Charged-particle multiplicity Tracklet Reconstruction and Multiplicity Determination • |df| = |fSearch–fSeed| < 0.3 • |dh| =|hSearch–hSeed| < 0.1 Combinatorial Background Acceptance + Efficiency Correction Factor
Acceptance and Efficiency Correction Factor a • corrects for: • azimuthal acceptance of the detector • tracklet reconstruction efficiency • secondary decays depends on: • Z-vertex position • multiplicity in detector (hits) a 19.6 GeV 200 GeV Hits in Outer Vertex Layer / 20
Combinatorial Background Correction Factor b Data • Combinatorial background: • formed by rotating Inner Vertex Detector layers 1800 about the beam pipe b= Nbg_tracklets/Nreconstructed Counts Dh MC Counts Dh Tracklets/Background for 80 to 100 Hits in Outer Vertex Layer 19.6 GeV, b =0.76
200 GeV (measured UA5) 19.6 GeV (interpolated ISR) Measured pseudorapidity density per participant pair as a function of <Npart> • ‘Geometry-normalized’ multiplicity in Au-Au collisions higher than corresponding values for inelastic • Percentile cross-section • 0-50% for 200 GeV • 0-40% for 19.6 GeV 90 % C.L.
inelastic data points • 200 GeV • Measured by UA5 Z.Phys C33 1 (1986) • dN/dh = 2.29±0.08 • 19.6 GeV • Interpolated from ISR data Nucl.Phys. B129 365 (1977) • dN/dh = 1.27±0.13
Measured pseudorapidity density per participant pair as a function of <Npart> • Models predictions • Hijing • does not follow data trend • Saturation Model (KLN) Phys.Lett.B523 79 (2001) arXiv:hep-ph/0111315 • better agreement 90 % C.L.
Measured pseudorapidity density per participant pair as a function of <Npart> • Two-component parametrization Phys.Lett. B507 121 (2001) • Models a ‘contribution’ from hard processes x = 0.13±0.01(stat)±0.05(syst) • Surprising agreement of the obtained x values 90 % C.L.
Divide by the corresponding • Remarkable similarities between the two data sets • Similar Npart dependence • Observed level above participant scaling depends on the pp reference
Ratio of the two data sets – systematic errors • Most of the systematic errors on the individual measurements at the two energies will cancel in the ratio • Analyses performed with the same method • Detector • Centrality determination • Percentile cross-section used in ratio • top 40% • Errors are estimated as 1-s.
Ratio of the two data sets – systematic errors • Ra • Most of geometry/efficiency effects cancel in the ratio • Contribution from secondary decays • Rb • b is found to be the same for Data/MC for the two data sets • Uncertainty from measured y-beam position • RNpart • Nucleon-nucleon inelastic cross-section • MC simulations of the detector response • Glauber model calculations
Ratio of the two data sets –systematic and statistical errors • RNrec • Counting statistics • Uncertainty in trigger efficiency (centrality bin position) • central events 0% • mid-central events 6% • Final 1-s systematic and statistical error • Centrality dependent • central events 3% • mid-central events 7%
Ratio for the data sets • Data ratio • Au+Au1 (fixed fraction of cross-section) 1-s errors
Ratio for the data sets • Data ratio • Au+Au1 (fixed fraction of cross-section) • No centrality (geometry) dependence • R = 2.03 ± 0.02 ± 0.05 (simple scale-factor between 19.6 and 200GeV) 1-s errors
Ratio for the data sets • Data ratio • Au+Au1 (fixed fraction of cross-section) • No centrality dependence • R = 2.03 ± 0.02 ± 0.05 • Au+Au2 (fixed <Npart>) • No centrality dependence 1-s errors
Ratio for the data sets • Models • Hijing • increase in mid-rapidity with centrality • Saturation Model (KLN) • flat centrality dependence as in data 1-s errors
Other ‘Geometry Scaling’ observations in • Multiplicity • 200/130 GeV mid-rapidity ratio Phys.Rev.C65 061901(R) (2002) • 19.6-200GeV Nch/<Npart/2> • Plot from QM 2002 talks
Charged hadron pT spectra Ratio of yield for200 and 62.4 GeV is centrality independent for all measured pT bins Other ‘Geometry Scaling’ observations in
Conclusions • We measured charged-particle pseudorapidity density at mid-rapidity for Au-Au collisions at 200 and 19.6GeV • Centrality, derived from different h-regions for each of the two Au-Au collision energies, yield consistent results • An increase in particle production per participant pair for Au-Au compared to the corresponding values for collisions • The ratio of the measured yields for the top 40% in the cross section gives a simple scaling factor between the two energies.