Download
1 / 16
160 likes | 228 Views
A comprehensive tool to display entities, functions, and their relationships in matrix form, facilitating data analysis and system design. Customize axes, apply filters, and manipulate display settings for efficient management and reporting. Save changes automatically and utilize broadcasting features for seamless collaboration.

E N D
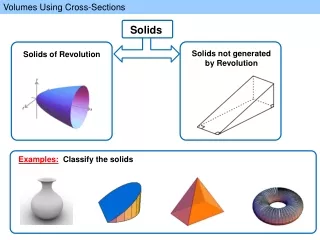
Setting the Scene The ER Diagrammer shows all Entities and Relationships... … and the Function Hierarchy Diagrammer shows all business functions... … but I want to see both Entities and Functions... How about a matrix?
column row third axis intersection(cell) The Matrix Diagrammer • A two-dimensional Repository object display tool • Is not like ERD, PM, or DFD • Can maintain definitions • Shows CRUD matrixes and many others
Defining Both Matrix Axes • Choose both object types for the horizontal and vertical axes • Most of the primary access elements • Some secondary access elements • Choice of second object type depends on choice of first axis
New Matrix Dialog Initial Appearance Choose Row Type Choose Column Type
Defining What is Displayed • Properties displayed per object type and intersection (cell) • Filters to reduce number of axis elements • Sort order of objects
1 1 Displaying Properties Row - Business Functions Column - Entities Intersection-FunctionEntity Usage Properties View Order Filter Lines LabelShort DefinitionMaster FunctionParent FunctionAtomic?Elementary?FrequencyResponse NeededIntention to AutomateApplication System A is null D =‘Y’ Resulting Pseudo-SQL: SELECT label, response_neededFROM business_functionsWHERE master_function IS NULLAND elementary? =‘Y’ORDER BY short_definition, atomic? desc
Defining Filter Conditions • Limited, SQL-like criteria: • =, >, <, >=, <=, <> • IS NULL, IS NOT NULL • value1 and value2 • ‘A%’, ‘_MEM%’ • No ORs, only implicit ANDs • No Not Like
Attributes Business Functions LINE NO RENTAL DATE C*** C*** CR** *R** *R** *R** CRU* **U* **U* RENTAL RENTAL ITEM REVIEW PUBLICATION entities Displaying a Third Axis PRICE PA Settings automatically shows Entities tab
Uses of a Matrix • Data entry • Completeness checking • Design reporting • Impact analysis • Repository management • Progress reporting
Saving the Matrix • Changes to data are saved automatically in the Repository. • Saving a matrix means saving the matrix settings. • A matrix is automatically requeried when opened. • Broadcast is available for axis elements.
Summary • Matrix Diagrammer: • Display and compact reporting tool • Used for verification and correction of entries • Over 160 different matrixes • Over 40 3D matrixes