Download
1 / 30
300 likes | 328 Views
Explore the power of interactive visualization in analyzing complex data rapidly and uncovering important insights effortlessly. Learn about its applications in economic research and investment funds and how it leads to better understanding and discovery of new relationships. See examples like City’O’Scope and Fund’O’Scope demos that showcase the capabilities of interactive visualization tools in providing a comprehensive overview and facilitating exploration and comparison.

E N D
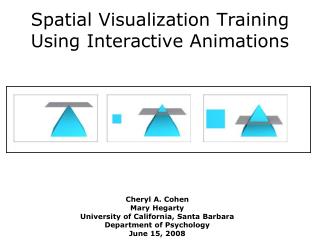
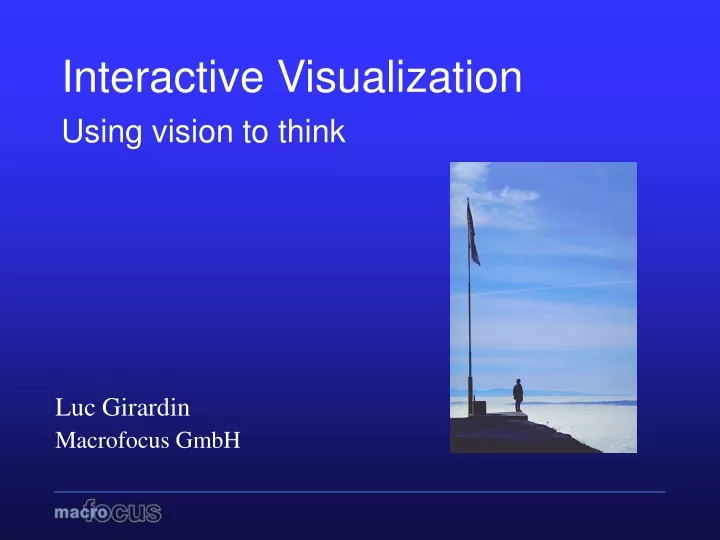
Interactive VisualizationUsing vision to think Luc Girardin Macrofocus GmbH
Overview • Introduction • An example: Economic Research • Interactive Visualization • Another example: Investment Funds • Summary Interactive Visualization
What is the problem? • Amounts of complex data growing faster than capability to analyze it • We know how to collect data and build big data warehouses but… We are lost in this space • Data Information Knowledge Interactive Visualization
Example: Economic research • Survey of prices and earnings in 60 cities around the world • Each city characterized by 40+ different attributes Interactive Visualization
City’O’Scope Demo Interactive Visualization
Interactive visualization • Use perceptual skills • Provide an overview of global relationships • Frame of reference to embed fine grained tasks • Overview – Zoom in – Details on demand • Encourage exploration and comparison • Reveal the data at several levels of detail Interactive Visualization
Our approach • Integrated systems • Preserve context • Different views • Tightly linked • Highly interactive Interactive Visualization
- Is this an outlier? - Are there groups of similar objects? - How do these groups relate to each other? - What is this object? - Why is it an outlier? - If I change this parameter a little bit, . how will the result be affected?
A different approach… Interactive Visualization
Fund’O’Scope Demo Interactive Visualization
Spring-based layout algorithm Interactive Visualization
i-lists before after Interactive Visualization
-blended parallel coordinates before after Interactive Visualization
What did we learn? • Not enough to connect database to the Web • Tools that fit the way we think and work • Easier and faster data access • Better understanding of information space • Discover new relationships, anomalies Interactive Visualization
www.macrofocus.com E-mail: info@macrofocus.com
Nanotechnology Interactive Visualization
From the lab… Interactive Visualization
…to the Web Interactive Visualization
Atom’O’Scope Demo Interactive Visualization