Download
1 / 17
190 likes | 389 Views
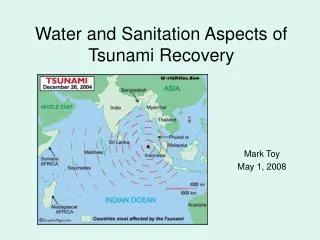
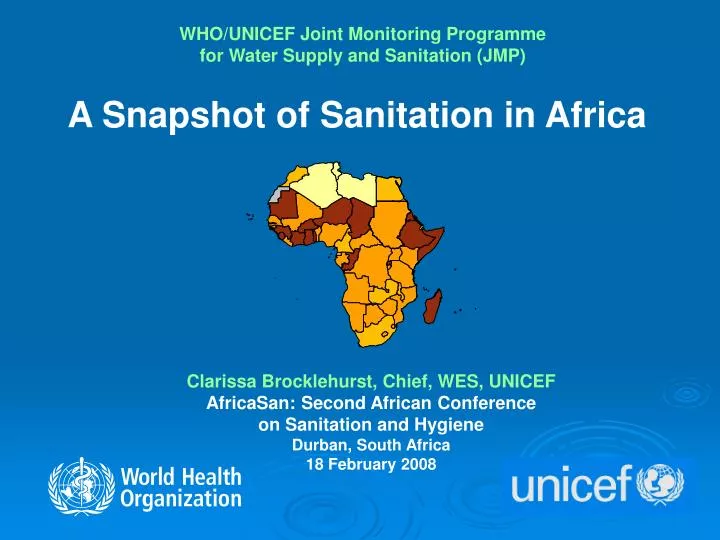
A Snapshot of Sanitation in Africa. WHO/UNICEF Joint Monitoring Programme for Water Supply and Sanitation (JMP). Clarissa Brocklehurst, Chief, WES, UNICEF AfricaSan: Second African Conference on Sanitation and Hygiene Durban, South Africa 18 February 2008.

E N D
A Snapshot of Sanitation in Africa WHO/UNICEF Joint Monitoring Programmefor Water Supply and Sanitation (JMP) Clarissa Brocklehurst, Chief, WES, UNICEF AfricaSan: Second African Conference on Sanitation and Hygiene Durban, South Africa 18 February 2008
Progress in Africa towards theMDG sanitation target MDG sanitation target: Halve, by 2015, the proportion of people without access to basic sanitation Africa Baseline 1990: 67% without access to basic sanitation MDG target 2015: 34% without access to basic sanitation MDG indicator for access to basic sanitation: “Proportion of people using an improved sanitation facility, urban and rural
MDG definitions An improved sanitation facility hygienically separates human waste from human contact • Improved sanitation • Flush/pour flush to: • piped sewer system • septic tank • pit latrine • Ventilated improved pit (VIP) latrine • Pit latrine with slab • Composting toilet • Unimproved sanitation • Pit latrine without slab/ • open pit • Bucket • Hanging toilet/hanging latrine • Flush/pour flush to elsewhere • No facilities, bush or field (open defecation) • Shared or public facilities
WHO/UNICEF Joint Monitoring Programme for Water Supply and Sanitation (JMP) • Mandated by the UN to monitor global progress towards the MDG water and sanitation target • Use of national data sources: • National censuses • Household sample surveys (DHS, MICS, WHS, LSMS, CWIQ etc.) • Use of standard definitions and indicators to ensure data are comparable between countries and over time
0 - 25% 26 - 50% 51 - 75% 76 - 100% No data In 16 of the 54 countries in Africa, sanitation coverage is less than 25 per cent Percentage of population using an improved sanitation facility, 2006 Note: The boundaries and names shown and the designations used on this map do not imply official endorsement or acceptance by the United Nations and WHO.
Trends in sanitation practices, 1990 - 2006 % practising open defecation % using unimproved facilities % using shared sanitation % using improved sanitation All Africa
Sanitation practices by African sub-region, 1990-2006 Open defecation Unimproved Shared Improved Northern Africa Southern Africa Central Africa Eastern Africa Western Africa
More than three quarters of urban dwellers use improved or shared sanitation while over 200 million rural residents practise open defecation Urban Africa Rural Africa
Population without improved sanitation increased from435 million in 1990, to 589 million in 2006
The Bad News: Africa is not on track to meet the MDG sanitation target (MDG target)
On track Progress but insufficient Not on track Insufficient or no data The Good News: Five countries in Africa are on track to meet the MDG sanitation target Progress towards the MDG Sanitation target, 2006 Note: The boundaries and names shown and the designations used on this map do not imply official endorsement or acceptance by the United Nations and WHO.
We need an almost five fold increase in people achieving access every year In 2006, 354 million people in Africa used improved sanitation By 2015, 762 million people in Africa need to be using improved sanitation
Summary • Of the 933 million people in Africa: • 354 M already use improved sanitation • 355 M have shown they wantsanitation and use shared or unimproved facilities • 234 M still practise open defecation • practice of open defecation is declining • Enormous potential exists