Download
1 / 3

E N D
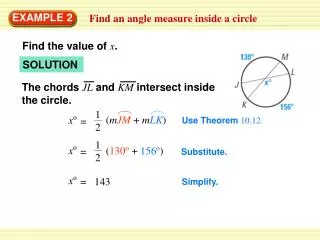
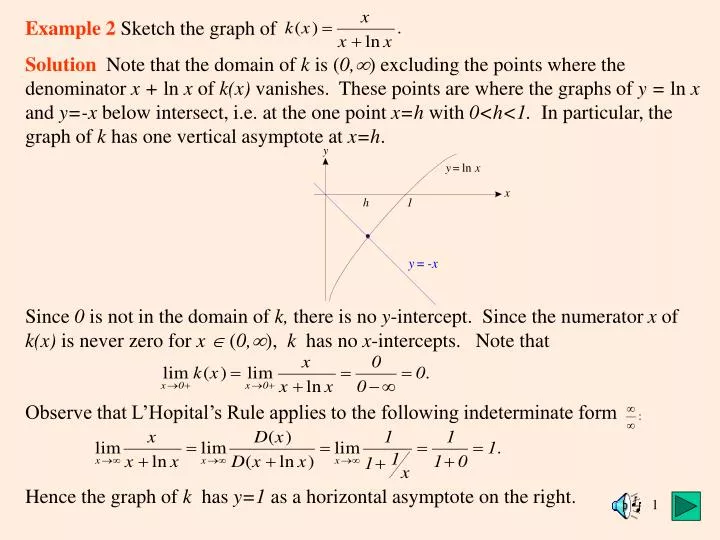
Example 2 Sketch the graph of Solution Note that the domain of k is (0,) excluding the points where the denominator x + ln x of k(x) vanishes. These points are where the graphs of y = ln x and y=-x below intersect, i.e. at the one point x=h with 0<h<1. In particular, the graph of k has one vertical asymptote at x=h. Since 0 is not in the domain of k, there is no y-intercept. Since the numerator x of k(x) is never zero for x (0,), k has no x-intercepts. Note that Observe that L’Hopital’s Rule applies to the following indeterminate form Hence the graph of k has y=1 as a horizontal asymptote on the right.
Next, compute the derivative of k by the quotient rule: Since ln e =1, k has exactly one critical point at x=e. The sign of k/(x) is the same as the sign of its numerator and is sketched on the following number line. Thus k is decreasing for x<e and is increasing for x>e. By the First Derivative Test, k has a local minimum at x=e. Now compute the second derivative of k by the quotient rule:
Compare the graphs of y=3x+2 and y=(2x+1)(ln x). We see that they cross at a unique point x=p>e. The sign of the second derivative is given on the following number line. Hence k is concave down for x<h or x>p while k is concave up for h<x<p. Since the concavity changes at x=p, there is an inflection point there. The graph of k is sketched below. y=(2x+1)(ln x) vert. asymptote: x=h hor. asymptote: y=1 incr: x>e decr: x<e local min: x=e conc. up: h<x<p conc. down: x<h or x>p inf. pt: x=p