Download
1 / 29
290 likes | 535 Views
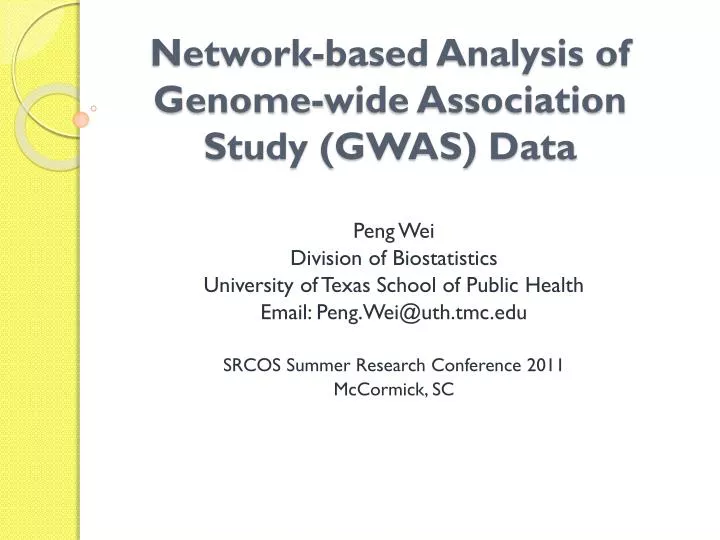
Network-based Analysis of Genome-wide Association Study (GWAS) Data . Peng Wei Division of Biostatistics University of Texas School of Public Health Email: Peng.Wei@uth.tmc.edu SRCOS Summer Research Conference 2011 McCormick, SC. Outline. Background and Introduction GWAS

E N D
Network-based Analysis of Genome-wide Association Study (GWAS) Data Peng Wei Division of Biostatistics University of Texas School of Public Health Email: Peng.Wei@uth.tmc.edu SRCOS Summer Research Conference 2011 McCormick, SC
Outline • Background and Introduction • GWAS • Biological networks • Statistical Methods • Gene-based association test • Markov random field-based mixture model • Diffusion kernel-based mixture model • Numerical Results • Conclusion and Discussion
Background: GWAS Manolio TA. N Engl J Med 2010; 363: 166-176.
Background: GWAS • SNP-by-SNP Analysis • Top hits may not have functional implications • Millions of dependent tests due to linkage disequilibrium (LD) among SNPs – low power • GWAS pathway enrichment analysis: • Uses prior biological knowledge on gene functions and is aimed at combining SNPs with moderate signals • e.g., to test if SNPs in the cell proliferation pathway show difference between cases and controls • However, genes within a pathway are treated exchangeably – interactions among genes ignored • Not every gene in a significant pathway is associated with the disease – identifying disease-predisposing genes remains a challenge
Background:Biological Networks Metabolic space Metabolite 1 Metabolite 2 Protein space Protein 2 Complex 3-4 Protein 4 Protein 1 Protein 3 Gene 2 Gene 3 Gene 4 Gene 1 Adapted from Brazhnik P et al.Trends Biotechnol. (2002) Gene space
Background: Gene Networks • HPRD (Human Protein Reference Database; Protein-Protein Interactions) -- yeast two-hybrid experiments + hand-curated, literature-based interactions --8776 genes, 35820 interactions • KEGG (Kyoto Encyclopedia of Genes and Genomes) -- Extracted from KEGG gene-regulatory pathway database -- 1668 genes, 8011 interactions
KEGG network (1668 genes; 8011 interactions)
Introduction: Network-based methods • Markov random field (MRF)-based mixture models have been proposed for incorporating gene networks into statistical analysis of genomic and genetic data: neighboring genes on a network tend to be co-associated with the outcome • Gene expression data: Wei and Li, Bioinformatics 2007; Wei and Pan, Bioinformatics 2008, JRSS-C 2010) • GWAS data: Chen et al, PLoS Genetics 2011
Methods: Network-based GWAS Analysis SNP data Gene-level summary Questions to be addressed here: Does the choice of network matter? Does looking beyond direct neighbors help?
Data: Crohn’s Disease (CD) • A type of inflammatory bowel disease • An auto-immune disease • High heritability– strong genetic link • Large number of confirmed loci (SNPs/genes) --105 genes at 71 loci based on meta-analysis of six GWAS (Frankeet al. Nature Genetics 2010)
Crohn’sDisease GWAS Data • Wellcome Trust Case Control Consortium (WTCCC) • 2,000 CD cases, 3,000 controls and a total of 500,568 SNPs • 1748 CD cases and 2938 controls and 469,612 SNPs Data Quality Control
Methods: From SNP Level to Gene Level • SNP to gene mapping– the “20Kb Rule” • Gene-level summary statistics • Principle component analysis (PCA) followed by logistic regression 20Kb 20Kb 5’-UTR 3’-UTR Gene eigen SNPs SNPs logitPr(Dj=1) = β0+ β1x1j + … + βpxpj H0: β1= β2= … = βp = 0
Methods: From SNP Level to Gene Level • Gene-level summary statistics • Alternative approach: Logistic Kernel- machine-based test (Wu et al AJHG 2010) • z-score transformation of gene-level p-values: zi = Φ-1(1-Pi), where Φ is the cdf of N(0, 1) logitPr(Dj=1) = β0+ h(z1j ,…,zpj) H0: h(z)=0
Methods: Standard Mixture Model (SMM): • Treats all genes equally a priori π0 = Pr(Ti=0) 1- π0 = π1= Pr(Ti=1) f0 ~ ϕ(µ0, σ02) f1 ~ ϕ(µ1, σ12) Ti: latent state of gene i Bayesian framework: p(T, θ|z) p(z |T, θ) p(T) p(θ) θ=(µ0, µ1, σ02, σ12) Statistical Inference: : p(Ti=1|z)
Methods: MRF-based mixture model (MRF-MM) • The latent state vector is modeled as a MRF via the following auto-logistic model , where is a real number, >0. Bayesian framework: p(T, θ,Φ|z) p(z |T, θ) p(T|Φ) p(θ) p(Φ) θ= (µ0, µ1, σ02, σ12), Φ= (β, γ) Statistical Inference: : p(Ti=1|z)
Comparison of gene-based tests (1435 genes on the KEGG network; red dots are 21 confirmed CD genes)
CD Pathway Wang K et al., Nat Rev Genet. 2010
Diffusion Kernel (DFK) • Diffusion Kernel (Kondor and Lafferty 2002): Similarity distance between any two nodes in the network. 1 if gene i ~ j Lij= -di if i = j 0 otherwise τ >0 : decay factor L: graph Laplacian di : # ofdirect neighbors of gene i exp(L): matrix exponential of L
Diffusion Kernel-based mixture model (DFK-MM) MRF: First-order (direct) interactions DFK: Interactions of all orders
Conclusion and Discussion • Does the choice of network matter? • Yes, the KEGG gene regulatory seemed to be more informative than the HPRD protein-protein-interaction network • Does looking beyond direct neighbors help? • Yes, the DFK-based model was found to be more powerful than the MRF-based model based on application to the CD GWAS data as well as simulated data (results not shown) • In summary, network-based models were demonstrated to be useful for gene-based GWAS analysis • Network information mainly boosted the power for discovering genes with moderate association signals
Potential problems and future work • Existing gene networks are incomplete – we use network information as informative prior • Types of networks matter: protein-protein interaction, gene regulatory, co-expression networks, etc – incorporate multiple networks simultaneously • Joint effect vs Marginal effect - regression framework
Acknowledgement • Joint work with Ying Wang (graduate student @ UT School of Public Health) • Support from UT SPH PRIME award