Download
1 / 18
190 likes | 2.26k Views
Biz-Café Breakeven and Cross-Over Bakery Strategy. Ted Mitchell. Biz-Café Bakery. Sell baked goods for $2.00 each with a volume at 30% of cups sold You have three options 1) buy an oven $4,000 and variable cost of 50¢ 2) buy ready-made at $1.00 each 3) do nothing. Breakeven Quantity.

E N D
Biz-Café Breakeven and Cross-Over Bakery Strategy Ted Mitchell
Biz-Café Bakery • Sell baked goods for $2.00 each • with a volume at 30% of cups sold • You have three options • 1) buy an oven $4,000 and variable cost of 50¢ • 2) buy ready-made at $1.00 each • 3) do nothing
Breakeven Quantity • The cost of the oven is F=$4,000. The average selling price of the pastry is P=$2 and the cost of making a pastry is V=50¢. How many pastry items must be sold to breakeven on the cost of the oven? • Z = PQ – VQ – F • 0 = $2Q – $0.5Q – $4,000 • 4,000 = 1.5Q • Q = 4,000/1.5 = 2,667 items to breakeven
Memorized the BEQ equation? • The cost of the oven is F=$4,000. The average selling price of the pastry is P=$2 and the cost of making a pastry is V=50¢. How many pastry items must be sold to breakeven on the cost of the oven? • BEQ = F/(P-V) • BEQ = 4,000/(2-0.50) = 4,000/1.5 • BEQ = 2,667 items
Forecasting sales • Breakeven Quantity = 2,667 items • Biz-Café is expecting 30% of its customers to buy a pastry and the normal weekly sales of coffee is 2,100 cups. How many weeks before the oven is paid for? • Forecasted sales 30% of 2,100 cups = 630 items a week • Time required = 2,667/630 = 4.2 or 5 weeks
Forecasting the Time it takes • using a Two-Factor Model • Quantity sold = (quantity per week) x (# of weeks) • Q = (Q/W) x W • Need to know the number of weeks, W • We know the • anticipated quantity sold per week, (Q/W) = 630 • quantity that needs to be sold to breakeven, Q = 2,667 • 2,667 = 630 x W • W = 2,667/630 = 4.2 or 5 weeks to breakeven
What if we had the option of • Renting rather than Buying the Oven • Renting the oven at F = $15 per week? The pastry sells for P = $2.00 per item and the variable cost per item is V = 50¢. What is the breakeven quantity each week? • BEQ = F/(P-V) • BEQ = $15/(2.00 – 0.50) • BEQ = 10 items a week
Is it reasonable to sell 10 items a week? • Your normal weekly sales are 2,100 cups • You anticipate 30% of the cup sales will be pastry sales • Anticipated pastry sales =2,100 x 30% • Anticipated pastry sales = 630 items a week • Only need 10 sales per week to breakeven on the rental cost!
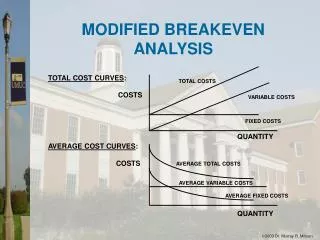
Is the Breakeven Quantity for the Total Cost of the Oven Useful? • There are two numbers that could be used • 1) The Total Cost of the Oven, F = $4,000 • 2) The allocated or depreciated cost of the oven each week • The oven is depreciated over 5 years or over (52 x 5 =) 260 weeks • The cost of the Oven each week is • $4,000/260 weeks = $15.38 per week
Depreciation is NOT cash • Use Depreciation when planning forward to calculate breakeven with a meaningful matching of costs and revenues each week • Do NOT use Depreciation when calculating the profit impact when dropping the bakery business • The Cost of the Oven is a Sunk Cost!
Breakeven Quantity for buying ready-made pastry? • What is the breakeven volume if the Biz-Café buys the ready-made pastry for $1.00 each and sells them for $2.00 each? • BEQ = 0itemsThere are no fixed costs to cover!
What is the Better Deal? • Option 1 Baking our own pastry each week • Profit Contribution = (Price – Variable Cost) Quantity – Fixed Cost • Z1 = ($2.00 – $0.50)Q - $15.38 • Option 2 Selling Ready-Made pastry • Z2 = ($2.00 - $1.00)Q • Depends on the Volume Sold, Q • What is the Cross-Over Quantity
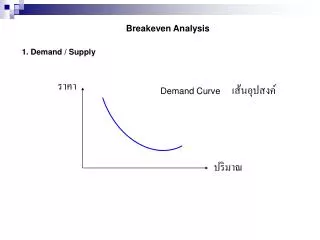
Cross Over PointBetween two profit contributions from two strategies Profit contributed by a strategy Q* Quantity Sold
Calculating the Cross-Over Quantity • Z1 = ($2.00 – 0.50)Q - $15.38 • Z2 = ($2.00 - $1.00)Q • Set Profit Contributions, Z, equal to each other • Z1 = Z2 • ($2.00 – 0.50)Q* - $15.38 = ($2.00 - $1.00)Q* • $1.5Q* - 15.38 = $1.00Q* • ($1.50-$1.00)Q* = 15.38 • $0.50Q* = 15.38 • Q* = 15.38/0.5 • Q* = 30.76 cups per week is the cross-over point
Cross Over PointBetween two profit contributions from two strategies Profit contributed by a strategy Z1 = Own bakery Z2 = Ready Made 31 items Quantity Sold
Weekly Cross Over PointBetween two profit contributions from two strategies Profit contributed by a strategy Z1 = Own bakery Z2 = Ready Made Quantity Sold 31 items 630 items forecasted
It would have been far more interesting if the crossover point was 700 items sold and the anticipated sales were 630 items • Then you can have a qualitative discussion on the value of ambiance!
Any Questions • We have learned that cross-over analysis is useful and its potential for application is not obvious to most students