Download
1 / 19
200 likes | 346 Views
Experimental validation of an undersea free space laser network physical layer simulator. David Rashkin*, Fraser Dalgleish**, Ionut Cardei*, Bing Ouyang**, Anni Vuorenkoski**, Mihaela Cardei*

E N D
Experimental validation of an undersea free space laser network physical layer simulator David Rashkin*, Fraser Dalgleish**, Ionut Cardei*, Bing Ouyang**, Anni Vuorenkoski**, Mihaela Cardei* *Florida Atlantic University, Department of Computer and Electrical Engineering and Computer Science, Boca Raton, Florida **Ocean Visibility and Optics Lab, Harbor Branch Oceanographic Institute, Fort Pierce, Florida
Agenda Introduction Physical Layer Simulator Experimental Setup Results Discussion / Future Work Questions
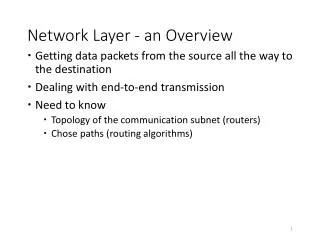
Introduction Complete network simulator requires accurate physical layer model Gbps communication requires laser sources capable of sub-nanosecond pulses With these timing requirements, it is necessary to understand how the channel affects the pulses Use 95% CL BER as performance metric
Physical Layer Simulator • Modulator • Channel Model • PMT Detector Model • Demodulator
Modulator Inputs: Sampling interval (1 ns) Source laser peak power (160 mW) Source laser variance (~ 3-5%) Modulation scheme (PPM-16) Pulse repetition rate (100Mhz, 200Mhz, 250Mhz, 500Mhz) Bitstream (pseudorandom) Outputs: 1 dimensional array representing clean signal
Channel Model Inputs: Beam attenuation coefficient (c) Absorption coefficient (a) Scattering phase function Position and orientation of source and receivers in 3D space Beam divergence Receiver half-angle, radius and acceptance shape Outputs: Two impulse response matrices, one for a receiver in forward direction and another for a receiver collecting the backscattered signal
PMT Detector Model Inputs: 1 dimensional array representing simulated signal in terms of optical power Source laser wavelength Detector quantum efficiency Detector gain Outputs: 1 dimensional array representing noisy signal in terms of voltage
PMT Detector Model Shot noise limited Continuous Poisson random variable Per-sample noise drawn from multivariate Gaussian distribution
Demodulator Inputs: 1 dimensional array representing noisy signal Pulse repetition rate (frequency) Sampling interval Modulation scheme Outputs: Demodulated bitstream
Experimental Setup North Lab West Lab Movable Catwalk (Z) Linear Drive (X,Y) East Lab 3 Axis Deployment Carriage • 12.5 x 7.5 x 2.5 m • Turbidity controlled using ISO 12103-1 A1 Ultrafine Arizonta Test Dust • Beam attenuation and absorption coefficients measured using Wet Labs AC9
Experimental Setup • Omicron A350 405nm pulsed laser,160mW peak power • Agilent 81130A pulse generator • Hamamatsu R9880U-210 PMT • PXI 5154 high speed 8-bit digitizer (1 Gsps)
Discussion / Future Work Off axis cases Full duplex / half duplex communication System design tool NLOS communication scenarios At-sea data
Acknowledgments ONR Joe Shirron, Metron Inc. Tom Giddings, Metron Inc. Benjamin Metzer, HBOI Walter Britton, HBOI Brian Ramos, HBOI Drew Krupski, HBOI
Previous Work [1] Dalgleish, Fraser; Vuorenkoski, Anni; Ouyang, Bing; Caimi, Frank; Shirron, Joseph; Giddings,Thomas; Mazel, Charles, “Experimental and analytical channel impulse Response investigation for distributed laser serial imaging and non line of sight communications sensors in turbid coastal conditions”, In Proc. Ocean Optics XXI, Glasgow, UK. October 2012. [2] Vuorenkoski, A. K., Dalgleish, F. R., Metzger, B., Giddings, T. E. and Shirron, J. J. "Multi-path effects on optical communications links," Proc. ONR/NASA Ocean Optics XX. Sept 27th-Oct 1st 2010. Anchorage, AK. [3] Rashkin, D.; Cardei, I.; Cardei, M.; Dalgleish, F.; Giddings, T., "Detector noise model verification for undersea free space optical data links," Oceans, 2012 , vol., no., pp.1,7, 14-19 Oct. 2012 [4] Ouyang, B. Dalgleish, F. R. Vuorenkoski, A.K., Britton, W.B., Ramos B. and Metzger, B., "Visualization for Multi-static Underwater LLS System using Image Based Rendering", IEEE Journal of Oceanic Engineering. 2012. (accepted)