Download
1 / 21
210 likes | 325 Views
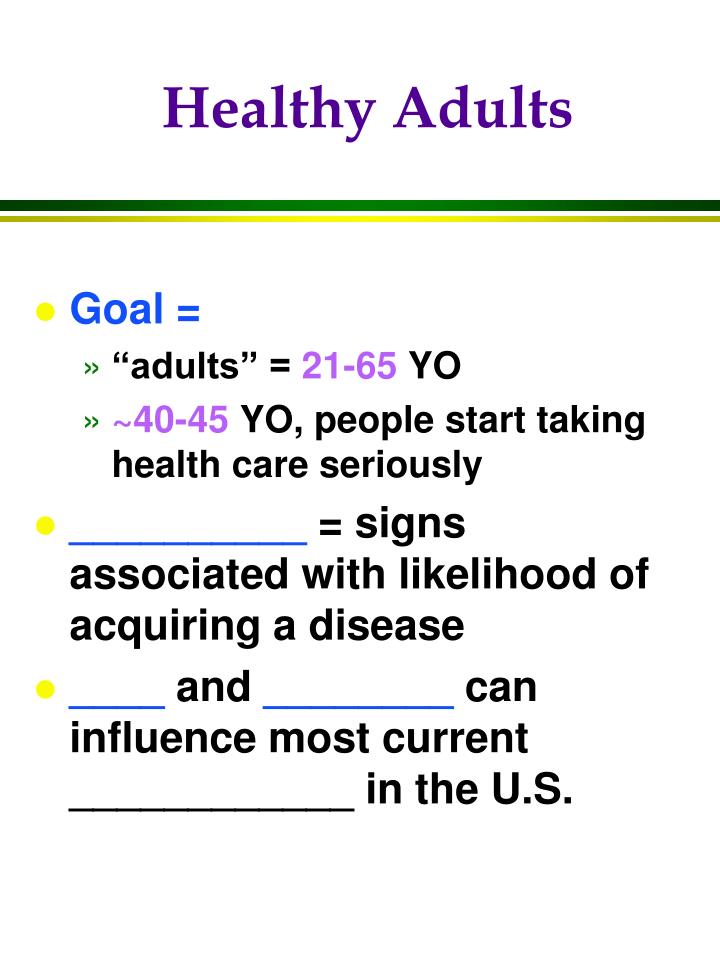
Healthy Adults. Goal = “adults” = 21-65 YO ~40-45 YO, people start taking health care seriously __________ = signs associated with likelihood of acquiring a disease ____ and ________ can influence most current ____________ in the U.S. Causes in which diet plays a part

E N D
Healthy Adults • Goal = • “adults” = 21-65 YO • ~40-45 YO, people start taking health care seriously • __________ = signs associated with likelihood of acquiring a disease • ____ and ________ can influence most current ____________ in the U.S.
Causes in which diet plays a part Causes in which alcohol plays a part Ten Leading Causes of Death in the U.S. (1900) Rank Cause of death 1 2 3 4 5 6 7 8 9 10 Pneumonia/influenza Tuberculosis Diarrhea and enteritis Heart disease Stroke Liver disease Accidents Cancer Diphtheria Meningitis
Causes in which diet plays a part Causes in which alcohol plays a part Ten Leading Causes of Death in the U.S. (2000) Rank Cause of death 1 2 3 4 5 6 7 8 9 10 Heart disease Cancer Stroke Lung diseases Accidents Diabetes Pneumonia/influenza Alzheimer’s disease Kidney disease Septicemia
Community ProgramsTargeting Adults • Food Stamps SNAP • Food programs: • Commodity Supplemental Food Program • Child and Adult Care Food Program (CACFP) • USDA Food Recovery and Gleaning Program • Community health centers • Cooperative Extension Service • EFNEP • Family Nutrition Program (FNP) • TEFAP • Medicaid • Title V MCH funds • WIC
____________ • “Access by all people at all times to sufficient food for an active and healthy life.” • ________ food • adequate and _____ food • ________ • for _________ life • acquired in ____________ ways
Poverty • Poverty guidelines • set by USDA • since 1965 • based on ____________ X 3.3 • adjusted annually according to ________________ • Thrifty Food Plan: • Emergency, short-term diet • one of 4 nutrition plans: Thrifty, Low-cost, Moderate, Liberal
Poverty • Poverty stats • $22,050 annually for a family of four (2009) • ~37,000,000 hungry in the U.S. (Census Bureau, 2007) • 11% of households • 1 in ___ children • The ________ the income, the _______ the nutritional status of a family
Poverty • Poverty stats • $22,050 annually for a family of four (2009) • ~46,200,000 poor in the U.S. (Census Bureau, 2010) = 15.1% (up from 14.3% in 2009) • The lower the income, the worse the nutritional status of a family
Food Stamp Program is now SNAP • Supplemental Nutrition Assistance Program • __________ program • Eligibility: • _________gross income • _________net income • certain exemptions to definition of net income • more income allowed if ________ in household
Food Stamp to SNAP changes • Eligibility: • asset limit “relaxed” in 2008 • $20 million authorized for pilot projects to increase fruit and vegetable intake, improve health status, reduce obesity • Food “stamps” eliminated; all benefits by EBT
SNAP Program • Goal = • Benefits: • provided via _______ • amount varies with income, size of household, housing costs, etc. • ~ amount needed for the household unit to ________________
SNAP Program • Excludes RTE foods, medications, pet foods, tobacco, alcohol, cleaning supplies… • Education is via state plans • http://www.ers.usda.gov/AmberWaves/November08/Features/AffordHealthyDiet.htm
Household expenditures • ________ income: • 50% income on food, clothing, shelter (f/c/s) • 16% on food • ________ income: • 66% on f/c/s • 23% on food • _________: • 75% on f/c/s • 30% on food
Food Stamp Program • In 1970, Food Stamps served 4.3 million people a month and cost $577 million; • In 2008, SNAP served 28.4 million people a month and cost $34.6 billion • Average benefit in 2009 = $101 a month per person • $3.37 a day http://www.fns.usda.gov/snap/faqs.htm#9
SNAP Program • Average benefit in Indiana in 2010 = $132.29 a month per person • $4.40 a day
Homework • Work out a menu for a day • $13.20 • one person • Price the menu • Analyze the menu for nutritional adequacy • use MyPlate • Due Thursday, November 17 • (alternative is to cost and analyze one day of your typical intake. Then indicate how your food costs compare to SNAP.)
Maximum SNAP allotment http://www.fns.usda.gov/snap/faqs.htm#9
2009 DHHS Poverty Guidelines http://aspe.hhs.gov/poverty/09poverty.shtml
Maximum SNAP allotment http://www.fns.usda.gov/snap/faqs.htm#9
2010 DHHS Poverty Guidelines http://www.hhs.gov/opa/pdf/poverty-guidelines-2010.pdf