Download
1 / 23
230 likes | 327 Views
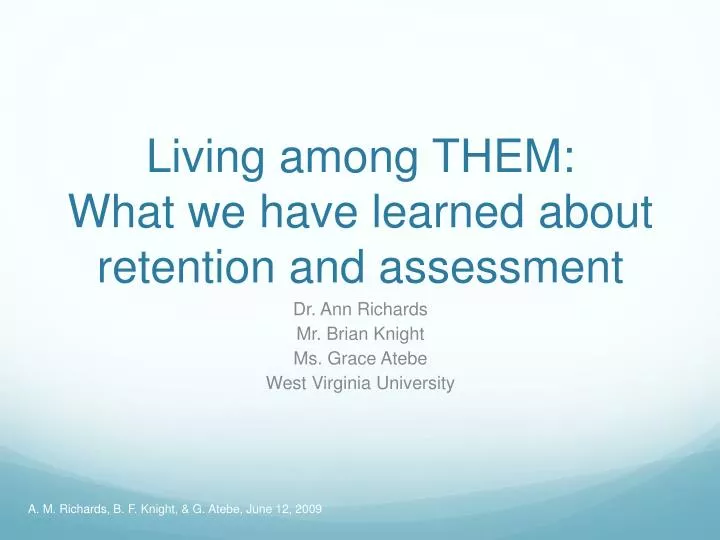
Living among THEM: What we have learned about retention and assessment. Dr. Ann Richards Mr. Brian Knight Ms. Grace Atebe West Virginia University. Goals of the Presentation. Understand the history and impact of changing student needs on retention programming and assessment models

E N D
Living among THEM: What we have learned about retention and assessment Dr. Ann Richards Mr. Brian Knight Ms. Grace Atebe West Virginia University A. M. Richards, B. F. Knight, & G. Atebe, June 12, 2009
Goals of the Presentation • Understand the history and impact of changing student needs on retention programming and assessment models • Understand how the mind frame of millennials impacts retention programming and assessment models • Understand specific details, logistics and strategies in developing and implementing retention and assessment programs • Reflect on their universities retention and assessment programs • Learn and discuss ideas and successful approaches for integrating our experiences and data into their current retention and assessment programs A. M. Richards, B. F. Knight, & G. Atebe, June 12, 2009
We know 27.5% of people 25 or older hold bachelors degrees http://factfinder.census.gov/servlet/GRTTable?_bm=y&-geo_id=04000US18&-_box_head_nbr=R1502&-ds_name=ACS_2007_1YR_G00_&-_lang=en&-redoLog=false&-format=US-30&-mt_name=ACS_2007_1YR_G00_R1502_US30&-CONTEXT=grt A. M. Richards, B. F. Knight, & G. Atebe, June 12, 2009
Retention Rate(nces.ed.gov & IPEDS) • A measure of the rate at which students persist in their educational program at an institution, expressed as a percentage • Four Year Institutions • Percentage of first-time bachelors degree seeking undergraduates that enroll in two subsequent fall semesters A. M. Richards, B. F. Knight, & G. Atebe, June 12, 2009
Alarming Statistic • Recent analyses of data based on high school seniors in 1972, 1982, and 1992 suggest that U.S. students’ access to college has increased over the last three decades, but rates of completion have not changed (Barton 2002; Adelman 2004) • http://nces.ed.gov/programs/coe/2004/section3/indicator19.asp A. M. Richards, B. F. Knight, & G. Atebe, June 12, 2009
So why, do we keep developing retention programs? A. M. Richards, B. F. Knight, & G. Atebe, June 12, 2009
Enrollment Projections • Undergraduate enrollment at 4-year institutions increased from 7.2 to 9.0 million (25 percent) from 2000 to 2007 and is expected to reach 10.0 million students in 2018 http://nces.ed.gov/programs/coe/2009/section1/indicator10.asp • Undergraduate enrollment in degree-granting postsecondary institutions increased from 7.4 million in 1970 to 13.2 million in 2000 and to 15.6 million in 2007. According to projections, enrollment in undergraduate institutions is expected to reach 17.5 million in 2018 http://nces.ed.gov/programs/coe/2009/section1/indicator10.asp A. M. Richards, B. F. Knight, & G. Atebe, June 12, 2009
Completion Data • Approximately 57 percent of full-time, first-time bachelor’s or equivalent degree-seekers attending 4-year institutions completed a bachelor’s or equivalent degree at the institution where they began their studies within 6 years http://www.nasfaa.org/publications/2009/rnnces031109.html A. M. Richards, B. F. Knight, & G. Atebe, June 12, 2009
What Impacts Retention? A. M. Richards, B. F. Knight, & G. Atebe, June 12, 2009
What should we consider when designing retention programs? • What do we represent? • What are our goals? • Who do we serve? • What strengths and challenges does our population bring? A. M. Richards, B. F. Knight, & G. Atebe, June 12, 2009
So should retention be Global or Institution Specific? A. M. Richards, B. F. Knight, & G. Atebe, June 12, 2009
What characteristics are Global or Institution Specific? A. M. Richards, B. F. Knight, & G. Atebe, June 12, 2009
Millennials (1982-2001) Characteristics/Core Traits(Strauss & Howe) • Special • Sheltered • Confident • Team-oriented • Conventional • Pressured • Achieving A. M. Richards, B. F. Knight, & G. Atebe, June 12, 2009
Are Millennials the only population we are serving? No, but they are the majority. A. M. Richards, B. F. Knight, & G. Atebe, June 12, 2009
Age Statistics • Millennials will be entering our institutions until 2019 • 25% of all students enrolled in Title IV institutions in fall 2007 were 18- to 24-year- olds attending public 4-year institutions http://www.nasfaa.org/publications/2009/rnnces031109.html A. M. Richards, B. F. Knight, & G. Atebe, June 12, 2009
Changing Communication and Engagement • Facebook • Linked In • Twitter • You Tube • Vanderbuilt • The Commons • http://commonplace.vanderbilt.edu/?v=1&s=1 A. M. Richards, B. F. Knight, & G. Atebe, June 12, 2009
Programming Look at what we do. A. M. Richards, B. F. Knight, & G. Atebe, June 12, 2009
What we have learned: The Hard Way! A. M. Richards, B. F. Knight, & G. Atebe, June 12, 2009
Team Approach • Dr. Ann Richards • Academic Programming • Social Programming • Past advising experience • Mr. Brian Knight • Support for academic programming • Support for social programming • Ms. Grace Atebe • Operations • Discipline • Supervisor of RAs • Resident Assistants A. M. Richards, B. F. Knight, & G. Atebe, June 12, 2009
Things we do: • Work as a team • Talk to the students • Make the learning interactive • Remember where they come from • Assist them in learning where you come from • Always keep a presence A. M. Richards, B. F. Knight, & G. Atebe, June 12, 2009
How we assess? • Talk to students • Look at participation trends • Look at risk factors against participation • Monitor progress (mid-term grades) • Adapt programming to meet changing student population • Monitor data continually A. M. Richards, B. F. Knight, & G. Atebe, June 12, 2009
Look at Our SUCCESS A. M. Richards, B. F. Knight, & G. Atebe, June 12, 2009
Any questions or comments please email Ann.Richards@mail.wvu.edu A. M. Richards, B. F. Knight, & G. Atebe, June 12, 2009