Download
1 / 89
890 likes | 928 Views
Learn how to measure, reduce, and price risk in investments, determining required rates of return for Treasury securities and corporate stocks/bonds. Explore expected returns, risk premiums, and how to make investment decisions based on risk and return analysis.

E N D
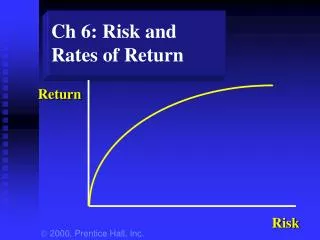
Risk and Rates of Return Return Risk
RISK • How to measure risk (variance, standard deviation, beta) • How to reduce risk (diversification) • How to pricerisk (security market line (SML), CAPM)
For a Treasury security, what is the required rate of return? Required rate of return =
For a Treasury security, what is the required rate of return? Risk-free rate of return Required rate of return = Since Treasury’s are essentially free of default risk, the rate of return on a Treasury security is considered the “risk-free” rate of return.
For a corporate stock or bond, what is the required rate of return? Required rate of return =
For a corporate stock or bond, what is the required rate of return? Risk-free rate of return Required rate of return =
For a corporate stock or bond, what is the required rate of return? Risk-free rate of return Required rate of return Risk Premium = + How large of a risk premium should we require to buy a corporate security?
Returns • Expected Return - the return that an investor expects to earn on an asset, given its price, growth potential, etc. • Required Return - the return that an investor requires on an asset given itsrisk.
Expected Return State of Probability Return Economy (P) Orl. Utility Orl. Tech Recession .20 4% -10% Normal .50 10% 14% Boom .30 14% 30% For each firm, the expected return on the stock is just a weighted average:
Expected Return State of Probability Return Economy (P) Orl. Utility Orl. Tech Recession .20 4% -10% Normal .50 10% 14% Boom .30 14% 30% For each firm, the expected return on the stock is just a weighted average: R = P(1)*R1 + P(2)*R2 + ...+ P(n)*Rn
Expected Return State of Probability Return Economy (P) Orl. Utility Orl. Tech Recession .20 4% -10% Normal .50 10% 14% Boom .30 14% 30% R = P(1)*R1 + P(2)*R2 + ...+ P(n)*Rn R (OU) = .2 (4%) + .5 (10%) + .3 (14%) = 10%
Expected Return State of Probability Return Economy (P) Orl. Utility Orl. Tech Recession .20 4% -10% Normal .50 10% 14% Boom .30 14% 30% R = P(1)*R1 + P(2)*R2 + ...+ P(n)*Rn R (OT) = .2 (-10%)+ .5 (14%) + .3 (30%) = 14%
Based only on your expected return calculations, which stock would you prefer?
Have you considered RISK?
What is Risk? • The possibility that an actual return will differ from our expected return. • Uncertainty in the distribution of possible outcomes.
Company A return What is Risk? • Uncertainty in the distribution of possible outcomes.
Company A Company B return return What is Risk? • Uncertainty in the distribution of possible outcomes.
How do we Measure Risk? • To get a general idea of a stock’s price variability, we could look at the stock’s price range over the past year.
How do we Measure Risk? • A more scientific approach is to examine the stock’s STANDARD DEVIATION of returns. • Standard deviation is a measure of the dispersion of possible outcomes. • The greater the standard deviation, the greater the uncertainty, and therefore , the greater the RISK.
Standard Deviation = (Ri - R) P(i) n i=1 s S 2
s n i=1 S 2 = (Ri - R) P(i) Orlando Utility, Inc.
s n i=1 S 2 = (ki - k) P(ki) n i=1 Orlando Utility, Inc. ( 4% - 10%)2 (.2) = 7.2
s n i=1 S 2 = (ki - k) P(ki) Orlando Utility, Inc. ( 4% - 10%)2 (.2) = 7.2 (10% - 10%)2 (.5) = 0
s n i=1 S 2 = (ki - k) P(ki) Orlando Utility, Inc. ( 4% - 10%)2 (.2) = 7.2 (10% - 10%)2 (.5) = 0 (14% - 10%)2 (.3) = 4.8
s n i=1 S 2 = (ki - k) P(ki) Orlando Utility, Inc. ( 4% - 10%)2 (.2) = 7.2 (10% - 10%)2 (.5) = 0 (14% - 10%)2 (.3) = 4.8 Variance = 12
s n i=1 S 2 = (ki - k) P(ki) Orlando Utility, Inc. ( 4% - 10%)2 (.2) = 7.2 (10% - 10%)2 (.5) = 0 (14% - 10%)2 (.3) = 4.8 Variance = 12 Stand. dev. = 12 = 3.46%
s n i=1 S 2 = (Ri - R) P(ki) Orlando Technology, Inc.
s n i=1 S 2 = (ki - k) P(ki) Orlando Technology, Inc. (-10% - 14%)2 (.2) = 115.2
s n i=1 S 2 = (ki - k) P(ki) Orlando Technology, Inc. (-10% - 14%)2 (.2) = 115.2 (14% - 14%)2 (.5) = 0
s n i=1 S 2 = (ki - k) P(ki) Orlando Technology, Inc. (-10% - 14%)2 (.2) = 115.2 (14% - 14%)2 (.5) = 0 (30% - 14%)2 (.3) = 76.8
s n i=1 S 2 = (ki - k) P(ki) Orlando Technology, Inc. (-10% - 14%)2 (.2) = 115.2 (14% - 14%)2 (.5) = 0 (30% - 14%)2 (.3) = 76.8 Variance = 192
s n i=1 S 2 = (ki - k) P(ki) Orlando Technology, Inc. (-10% - 14%)2 (.2) = 115.2 (14% - 14%)2 (.5) = 0 (30% - 14%)2 (.3) = 76.8 Variance = 192 Stand. dev. = 192 = 13.86%
Which stock would you prefer? How would you decide?
Which stock would you prefer? How would you decide?
Summary Orlando Orlando Utility Technology Expected Return 10% 14% Standard Deviation 3.46% 13.86%
Return Risk It depends on your tolerance for risk! Remember there’s a tradeoff between risk and return.
Portfolios • Combining several securities in a portfolio can actually reduce overall risk. • How does this work?
Suppose we have stock A and stock B. The returns on these stocks do not tend to move together over time (they are not perfectly correlated). rate of return time
RA • Suppose we have stock A and stock B. The returns on these stocks do not tend to move together over time (they are not perfectly correlated). rate of return time
Suppose we have stock A and stock B. The returns on these stocks do not tend to move together over time (they are not perfectly correlated). RA rate of return RB time
RA Rp RB • Suppose we have stock A and stock B. The returns on these stocks do not tend to move together over time (they are not perfectly correlated). rate of return time
RA Rp RB • What has happened to the variability of returns for the portfolio? rate of return time
Diversification • Investing in more than one security to reduce risk. • If two stocks are perfectly positively correlated, diversification has no effect on risk. • If two stocks are perfectly negatively correlated, the portfolio is perfectly diversified.
If you owned a share of every stock traded on the NYSE and NASDAQ, would you be diversified? YES! • Would you have eliminated all of your risk? NO! Common stock portfolios still have risk.
Some risk can be diversified away and some can not. • Market Risk is also called Nondiversifiable risk (SYSTEMATIC RISK). This type of risk can not be diversified away. • Firm-Specific risk is also called diversifiable risk (UNSYSTEMATIC RISK). This type of risk can be reduced through diversification.
Market Risk • Unexpected changes in interest rates. • Unexpected changes in cash flows due to tax rate changes, foreign competition, and the overall business cycle.
Firm-Specific Risk • A company’s labor force goes on strike. • A company’s top management dies in a plane crash. • A huge oil tank bursts and floods a company’s production area.
As you add stocks to your portfolio, firm-specific risk is reduced.
As you add stocks to your portfolio, firm-specific risk is reduced. portfolio risk number of stocks
As you add stocks to your portfolio, firm-specific risk is reduced. portfolio risk Market risk number of stocks