Download
1 / 10
100 likes | 127 Views
Understand the significance of log-likelihood in statistical modeling, especially in differentiating fixed and random effects. Learn how log-likelihood improvements affect model accuracy and parameter estimation. Utilize log-likelihood criteria for precise fuel data analysis.

E N D
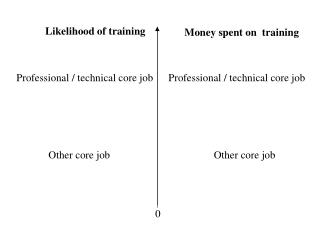
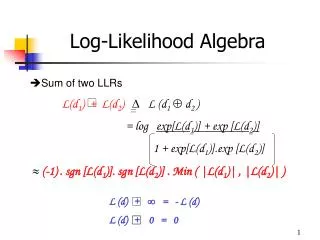
Use Log-Likelihood Instead of Fixed Effect Significance • Statisticians call log-likelihood the “Gold Standard” for fitting a model • A mixed model uses a random effect and a fixed effect • the random effect measures whether the responses differ from vehicle to vehicle • the fixed effect measures the average response across the fleet • log-likelihood improvement measures the combined significance of both effects
Use Log-Likelihood • For most cases the log-likelihood improvement criteria and fixed effect significance lead to the same model • Differences occur when the log-likelihood improvement is highly significant but the fixed effect is not fully significant (i.e. <95%) • This means random effect extremely important • Eliminating a parameter at such a point implies that the vehicle to vehicle variance will be confounded into other parameters
Use Log-Likelihood • Example is fuel oxygen for emitters > 410mg • Log-likelihood improvement significant but fixed effect may often be less than 95% significant • Data specific to oxygen in such vehicles shows strong effect • data from EPA_ATL1 missing due to 4.0 cut off with 2.7 oxygen cap • EPA_ATL1 used 4.1 fuel and cap is now 3.5
Use Log-Likelihood • Gives more correct representation of the data • If random effect is significant, then effect varies from vehicle to vehicle and model would be wrong if it assumes the effect was constant. • Also without this parameter the model will attempt to fit this variance with some other parameter
Use Log-Likelihood • If fixed effect is not significant but overall effect is significant, then have wide and significant variation from vehicle to vehicle but the average impact might be zero. • However, the best estimate of an average effect is generally not zero. • Assuming zero is forcing the model to arbitrarily assume an average of zero rather than the best estimate
Fix Database • EPA_ATL1 fuel H (4.1% oxygen) should be added • raising cap from 2.7 to 3.5 implies 5.2 upper limit to database • methanol data at 5.3% oxygen but RVP of this data is near 12 psi • Federal Register (59 FR 36944) shows that 10 volume ethanol (nominal 3.5 wt) can be legal to 4.0% oxygen
Fix Database • Duplicates exist in EPA_ATL1 data • Six vehicles used in ATL2 involved • Fuels involved are C, D, E, F, G, and H • Also note single tests used in EPA study, but multiple tests used in other studies • SAS Mixed Model weights by number of tests • While certainly “better” are they twice or more? • Could use fuel/vehicle averages as bracket model • Auto/Oil used averages to study fuel effects
Reasons to include >410 mg effects • Engineering • High mileage with poor catalyst efficiency that fuel oxygen might improve • Any open loop operation that fuel oxygen is known to improve • Rich fuel/air mixtures that fuel oxygen may mitigate
Reasons to include >410 mg effects • Scientific • To be more consistent with data such as the EPA_ATL study which directly addressed the comparison of fuel oxygen between low and higher emitting vehicles • Higher emitter effects noted as important by recent NAS panel on ethanol in RFG
Reasons to include >410 mg effects • Environmental • higher emitter fraction increases with age • database will have more higher emitters in 2005