Download
1 / 19
200 likes | 218 Views
Learn about quadratic functions, axis of symmetry, vertex, minimum/maximum values, and graphing parabolas in standard form. Practice identifying domain, range, and intercepts. Explore examples of finding the axis of symmetry and vertex for various quadratic functions.

E N D
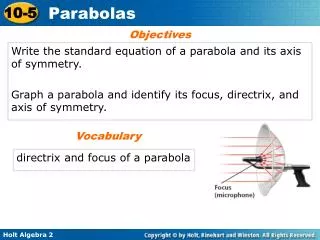
Vocabulary axis of symmetry standard form minimum value maximum value
Notes 1. State the shifts and sketch. Name domain and range. A) f(x)= -x2 + 4 B) f(x)= -2x2 + 4 2. Consider the function f(x)= 2x2 + 6x – 7. A. Determine whether the graph opens up or downward. B. Find the axis of symmetry. C. Find the vertex. D. Identify the max or min value of the function. E. Find the y-intercept. F. Graph the function. G. State the domain and range of the function.
This shows that parabolas are symmetric curves. The axis of symmetry is the line through the vertex of a parabola that divides the parabola into two congruent halves.
Identify the axis of symmetry for the graph of . Example 1: Identifying the Axis of Symmetry Because h = –5, the axis of symmetry is the vertical line x = –5.
a in standard form is the same as in vertex form. In standard form, the axis of symmetry is x = -b/a In standard form, the y-intercept is (0,c)
These properties can be generalized to help you graph quadratic functions.
The axis of symmetry is given by . Example 2A: Graphing Quadratic Functions in Standard Form Consider the function f(x) = 2x2 – 4x + 5. a. Determine whether the graph opens upward or downward. Because a is positive, the parabola opens upward. b. Find the axis of symmetry. Substitute –4 for b and 2 for a. The axis of symmetry is the line x = 1.
Example 2A: Graphing Quadratic Functions in Standard Form Consider the function f(x) = 2x2 – 4x + 5. c. Find the vertex. The vertex lies on the axis of symmetry, so the x-coordinate is 1. The y-coordinate is the value of the function at this x-value, or f(1). f(1) = 2(1)2 – 4(1) + 5 = 3 The vertex is (1, 3). d. Find the y-intercept. Because c = 5, the intercept is (0,5).
Example 2A: Graphing Quadratic Functions in Standard Form Consider the function f(x) = 2x2 – 4x + 5. e. Graph the function. Graph by sketching the axis of symmetry and then plotting the vertex and the intercept point (0, 5).
The axis of symmetry is given by . Example 2B: Graphing Quadratic Functions in Standard Form Consider the function f(x) = –x2 – 2x + 3. a. Determine whether the graph opens upward or downward. Because a is negative, the parabola opens downward. b. Find the axis of symmetry. Substitute –2 for b and –1 for a. The axis of symmetry is the line x = –1.
Example 2B: Graphing Quadratic Functions in Standard Form Consider the function f(x) = –x2 – 2x + 3. c. Find the vertex. The vertex lies on the axis of symmetry, so the x-coordinate is –1. The y-coordinate is the value of the function at this x-value, or f(–1). f(–1) = –(–1)2 – 2(–1) + 3 = 4 The vertex is (–1, 4). d. Find the y-intercept. Because c = 3, the y-intercept is (0,3).
Example 2B: Graphing Quadratic Functions in Standard Form Consider the function f(x) = –x2 – 2x + 3. e. Graph the function. Graph by sketching the axis of symmetry and then plotting the vertex and the intercept point (0, 3).
Example 3: Finding Minimum or Maximum Values Find the minimum or maximum value of f(x) = –3x2 + 2x – 4. Then state the domain and range of the function. Step 1 Determine whether the function has minimum or maximum value. Because a is negative, the graph opens downward and has a maximum value. Step 2 Find the x-value of the vertex. Substitute 2 for b and –3 for a.
Step 3 Then find the y-value of the vertex, The maximum value is . The domain is all real numbers, R. The range is all real numbers less than or equal to Example 3 Continued Find the minimum or maximum value of f(x) = –3x2 + 2x – 4. Then state the domain and range of the function.
Example 3B Find the minimum or maximum value of f(x) = x2 – 6x + 3. Then state the domain and range of the function. Step 1 Determine whether the function has minimum or maximum value. Because a is positive, the graph opens upward and has a minimum value. Step 2 Find the x-value of the vertex.
Step 3 Then find the y-value of the vertex, Example 3B Continued Find the minimum or maximum value of f(x) = x2 – 6x + 3. Then state the domain and range of the function. f(3) = (3)2 – 6(3) + 3 = –6 The minimum value is –6. The domain is all real numbers, R. The range is all real numbers greater than or equal to –6, or {y|y ≥ –6}.
Notes 2. Consider the function f(x)= 2x2 + 6x – 7. A. Determine whether the graph opens upward or downward. B. Find the axis of symmetry. C. Find the vertex. D. Identify the maximum or minimum value of the function. E. Find the y-intercept. upward x = –1.5 (–1.5, –11.5) min.: –11.5 (0,–7)
Notes (continued) Consider the function f(x)= 2x2 + 6x – 7. F. Graph the function. G. Find the domain and range of the function. D: All real numbers;R {y|y≥ –11.5}