Download
1 / 38
390 likes | 694 Views
Clean Coal Combustion : Meeting the Challenge of Environmental and Carbon Constraints. A.R. Ericson. Our Vision for New Coal Power Portfolio of Clean Technologies. Near-zero emissions. Carbon Free Power. Concentrated CO2. O 2. Oxygen Fired CFB. or PC. COMPLETE COMBUSTION. CO2 2.

E N D
Clean Coal Combustion:Meeting the Challenge of Environmental and Carbon Constraints A.R. Ericson
Our Vision for New Coal Power Portfolio of Clean Technologies Near-zero emissions Carbon Free Power Concentrated CO2 O2 Oxygen Fired CFB or PC COMPLETE COMBUSTION CO22 PC Post-combustion capture USC PC Air USC CFB CFB CO2 Capture And Sequestration Carbonate looping CHEMICAL LOOPING COAL CO22 CO22 PARTIAL COMBUSTION CO2 Scrubbing PETROCHEMICAL O2 IGCC H2 H2 GT water shift Air IGCC Fuel Cell 3 AIR BLOWN IGCC
Presentation Roadmap Outlook for New Ultra Clean Coal Capacity • Market Realities • Environmental Performance – Mission Critical • Advanced Cycle Designs • Coal Generation in a Carbon Constrained World
Drivers for New CapacityNorth America Our economies continue to drive electricity demand growth Source: NERC 2006 Long Term Reliability Assessment
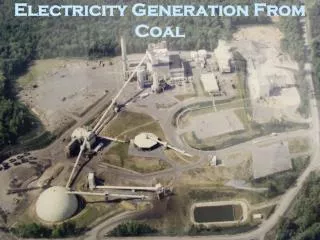
Existing US Coal FleetExpanding output to meet demand Equivalent to 45 GW of new coal capacity
Drivers for New Coal BuildNorth America • Base Energy needs versus Peaking Capacity • Base load demand expected to increase at roughly GDP • Economics • Fuel Cost • End User price shocks driving demand for low cost energy • Coal availability and prevalence • 200+ Years of Reserves in North America • Advent of OTC (over the counter) markets for coal and emissions • Environmental regulations drive new clean plants • Fuel diversity Source: U.S. EIA
New Coal CapacityFaces Challenges • Economics • Utilization of all low cost domestic coals …and opportunity fuels • Competitive costs • Operations • Highest reliability and commercial availability • Operating parameters to meet demands of grid • Environmental • Near zero emissions … • and a carbon strategy
2005 Wtg. Avg SO2 Emissions - US Coal Units PC and CFB Clean Coal technologies have demonstrated the lowest emissions : • Exceed Requirements • Cost Effectively • Reliably 0.08 Top 20 - Lowest SOx emitters 0.07 0.06 0.05 0.04 Lbs/MMBtu 0.03 0.02 0.01 0 2005 Wtd Avg NOx Emissions - US Coal Units Top 20 - Lowest NOx emitters 0.08 0.07 0.06 0.05 0.04 Lbs/MMBtu 0.03 0.02 0.01 0.00 Operating Coal Combustion – Best in Class Emissions Bit. PC SubBit. PC CFB IGCC (operating) Source: Energy Velocity database ( EPA CEMS 2005 data )
Ultra Clean Coal CombustionEmissions Control Capability • Today’s state-of-the-art • NOx >95% reduction with optimized firing systems and SCR • SO2>99% capture with Wet FGD and DBA • Particulates 99.99% capture • Hg 80- 95% capture (coal dependent) • Next steps • Continued improvements • Integrated Multi-pollutant systems to reduce costs • High Hg capture on all coals (without reliance on ACI) • Introduction of CO2 capture
Unit 3 Karlshamn Power Plant • Power capacity:3 x 340 MW • Fuel:Heavy fuel oil(max. 3.5% S)
FLOWPACKarlshamm Performance Levels Sulfur Content in the Fuel: 2.5%
When Additional Control is Needed -Mercury Capture Technologies • Additives: • Halogen(s) • Powdered Activated Carbon • Halogenated Powdered Activated Carbon = Potential additive injection points
Multi-pollutant APC Systems • Integrated APC systems based around commercially proven and reliable technologies • Use readily available reagents • Produces reusable byproduct(s) • No impact on fly ash • Superior cost/performance ratio: • Extremely compact design • Reduces capital costs for equipment, erection and BOP • Fewer moving parts reduces maintenance costs • Superior environmental performance • Reduced permitting schedule/cost • Avoided cost for SO2 credits • Targeted emissions levels: • SO2: 0.02 lb/MMBTU (> 99.5%) • Hg: 1.0 lb/TBTU (> 90%) • PM: 0.01 lb/MMBTU (99.99%) • NOx: 0.05 lb/MMBTU w/SCR • “Polishing” (Level TBD) w/o SCR Controls SOx, PM10/PM2.5 Mercury & NOx
Meeting the Challenge - Advanced Cycles
42% 40% 38% 36% Increased Value for Efficiency Annual Fuel Savings, MUSD 500 MW Unit Efficiency ~$10M/yr 16 ~$6.5M/yr 14 12 10 8 6 4 2 0 20 25 30 35 40 45 50 Coal Price USD/Short Ton Compared to 34% subcritical efficiency, 11,000 BTU/lb coal, 80% capacity factor
Efficiency – Critical to emissions strategy Source: National Coal Council From EPRI study 100% Coal Coal w/ 10% co - firing biomass Commercial Supercritical Existing US coal fleet @ avg 33% Net Plant Efficiency (HHV), %
Clear Trend to Supercriticalfor Global Steam Power Worldwide orders for new coal generation
Clear Trend to Advanced Supercritical Cycles 147 GW, 230 Supercritical Coal Fired Boilers Ordered Since 1990 GW Number of Units Maximum of SH or RH Temp Maximum of SH or RH Temp
SupercriticalFlexible for power grid needs • Operating Performance • Turndown – Supercritical PC/CFB units have • Flexibility to rapidly change load • Turndown to lower minimum loads during off peak • Maintain efficiency when operating at part loads • Excellent startup ramp rates to meet grid demand Supercritical Drum • Hot Start Up, after 2 hr shutdown • Warm Start Up, after 8 hr shutdown • Cold Start Up, after 36 hr shutdown
US-DOE :Ultra-Supercritical Boiler Project Operating Target: 1400°F/5500 psig European Thermie Project Operating Target: 1292°F/ 4500 psig Progression of Plant Efficiency via Advanced Steam Conditions and Plant Designs TARGET 48 - 50 % 41%- 43% Up to 5400/1300/1325(psi/°F/°F) 38-41% 37-38 Advanced USC 35-37% • -Efficiency (net) HHV • Typical Steam Parameters 4000/1110/1150(psi/°F/°F) 3480/1005/1050 (psi/°F/°F) UltraSupercritical 4000/1075/1110 (psi/°F/°F) Commercial State of Art Supercritical 2400/1005/1005 167/540/540 Sliding Pressure Supercritical Subcritical Technology Mature Supercritical Ni-based Materials Advanced Austenitic Materials Material Development T91 1960 1980 2000 2010 2020
Meeting the Challenge CO2 Reduction
CO2 Mitigation Options – for Coal Based Power • Increase efficiency Maximize MWs per lb of carbon processed • Fuel switch with biomass Partial replacement of fossil fuels = proportional reduction in CO2 • Then, and only then ….Captureremaining CO2 for EOR/Sequestration = Logical path to lowest cost of carbon reduction
CO2 Capture Innovative options continue to emerge and develop • Post Combustion Capture • Adsorption • Absorption • Hydrate based • Cryogenics / Refrigeration based • Oxy-fuel Firing • External oxygen supply • integrated membrane-based • Oxygen carriers (chemical looping) • Decarbonization • reforming (fuel decarbonization) • carbonate reactions (combustion decarbonization)
Amine-Based Absorption - CO2 Capture SHADY POINT, OKLAHOMA, USA An AES CFB power plant with MEA CO2 separation • MEA has demonstrated performance on coal based flue gas • Work required to address: • Regeneration power • Compression ratio • Cost of solvent
Advancements Absorption Stripping CO2 Capture Amine scrubbing continues to develop • Ionic Liquids “designer solvents” • “Piperazine” - alternative solvent • Process integration and improvement has driven cost down from 70 to 40-50 $/ton CO2 --- further progress expected • With industry focus on improvements, advanced amines likely to be competitive solution for post combustion capture
Energy Recovery CO2 Capture Innovations Chilled Ammonia System Existing Stack Existing SO2 Scrubber • Ammonia reacts with CO2 and water and forms ammonia carbonate or bicarbonate • Moderately raising the temperature reverses the above reactions – producing CO2 • Regeneration at high pressure Concentrated CO2 to Sequestration Flue Gas Energy Recovery Energy Recovery Energy CO Energy Recovery 2 Recovery CO2 Absorption Tower Tower CO2 Lean Fluid Regeneration CO2 Rich Flue Gas Cooling Flue Gas Cooling System
Advantages of Chilled Ammonia • High efficiency capture of CO2 • Low heat of reaction • High capacity for CO2 per unit of solution • Easy and low temperature regeneration • Low cost reagent • No degradation during absorption-regeneration • Tolerance to oxygen and contaminations in flue gas
We Energies Pleasant Prairie Host Site Location for 5MW Pilot
Carbon Free PowerAdvanced Combustion Innovative Combustion Options for 2010 and Beyond • Oxygen Firing – Direct concentration of CO2 to >90% for reduced capture costs • Chemical Looping –Leapfrog technology with potential to achieve significantly lower costs than PC/CFB/IGCC
Oxygen Firing to produce concentrated CO2 stream CO Recycle N 2 2 O Air Separation 2 Condenser Boiler Unit (ASU) Compressor H O O , N Fuel 2 2 2 Air in-leakage CO2 3 MWt pilot CFB • Oxygen Firing – Direct concentration of CO2 to >90% for reduced capture costs
Development Development Scale Scale - - up up Objective Objective Com Com Partners Partners Steps Steps Factor Factor Laboratory Laboratory Fundamentals of Fundamentals of 2004 2004 Universities (Stuttgart, Universities (Stuttgart, Tests Tests oxyfuel combustion oxyfuel combustion Chalmers, Dresden) Chalmers, Dresden) 2005 2005 10 / 55 kWth 10 / 55 kWth Vattenfall, ALSTOM.. Vattenfall, ALSTOM.. Test Plant Test Plant 1:50 1:50 Fundamentals of Fundamentals of 2005 2005 CEBra, BTU Cottbus, CEBra, BTU Cottbus, 500 kWth 500 kWth oxyfuel combustion oxyfuel combustion Vattenfall, ALSTOM Vattenfall, ALSTOM with flue gas with flue gas recirculation recirculation Pilot Plant Pilot Plant 1:60 1:60 Test of the oxyfuel Test of the oxyfuel 2008 2008 Vattenfall..., Vattenfall..., 30 MWth 30 MWth process chain process chain ALSTOM, others ALSTOM, others Demo Plant Demo Plant 1:20 1:20 Realisation with CO2 Realisation with CO2 2015 2015 600 MWth 600 MWth sequestration, sequestration, Commercial Commercial approx. approx. 2020 2020 Plant approx. Plant approx. 4 4 - - 5 5 1000 MWel 1000 MWel 30 MWth Oxy-fired PC Pilot Plant – Vattenfall Location of pilot plant in the Industrial Park Schwarze Pumpe
Depleted Air, Ash, CaSO4 CO2 & H2O CaS Coal, Limestone Air CaSO4 Reducer Oxidizer Future Technologies for CO2 CaptureChemical Looping Chemical Looping Gasification Calciner CO2 CaCO3 Cold Solids Chemical Looping Combustion CaCO3 CaO Hot Solids Hydrogen CaS Depleted Air, Ash, CaSO4 Reducer CaSO4 Oxidizer Air Coal, Steam
Multiple Paths to CO2 ReductionInnovations for the Future ‘Hatched’ Range reflects cost variation from fuels and uncertainty Technology Choices Reduce Risk and Lower Costs ------------------------------With CO2 Capture--------------------------- No CO2 Capture Note: Costs include compression , but do not include sequestration – equal for all technologies
Conclusions • New coal fired power plants shall be designed for highest efficiency to minimize CO2 and other emissions • Lower cost, higher performance technologies for postcombustion CO2 capture are actively being developed, and more are emerging • There is no single technology answer to suit all fuels and all applications • The industry is best served by a portfolio approach to drive development of competitive coal power with carbon capture technology