Download
1 / 41
410 likes | 514 Views
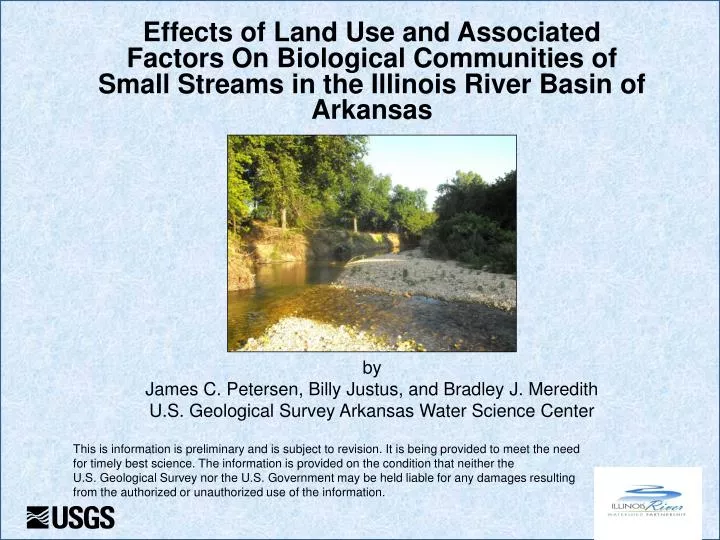
by James C. Petersen, Billy Justus, and Bradley J. Meredith U.S. Geological Survey Arkansas Water Science Center . Effects of Land Use and Associated Factors On Biological Communities of Small Streams in the Illinois River Basin of Arkansas.

E N D
by James C. Petersen, Billy Justus, and Bradley J. Meredith U.S. Geological Survey Arkansas Water Science Center Effects of Land Use and Associated Factors On Biological Communities of Small Streams in the Illinois River Basin of Arkansas This is information is preliminary and is subject to revision. It is being provided to meet the need for timely best science. The information is provided on the condition that neither the U.S. Geological Survey nor the U.S. Government may be held liable for any damages resulting from the authorized or unauthorized use of the information.
ACKNOWLEDGMENTS Funding--Illinois River Watershed Partnership (319 grant) Landowners--access
Study conducted in response to the watershed management plan
Site WWTP Complex land use effects Multiple stressors From IRWP
OBJECTIVE Describe relations between biological communities and environmental factors (land use, nutrients, and habitat)
SAMPLING APPROACH Select 18 sites—land use, basin size, WWTP Baseflowwater-quality sample (nutrients only, July-August of 2011, May-June 2012) Concurrently sample biological communities Concurrently measure habitat factors
DATA ANALYSIS APPROACH • Divide sites into categories: • Agriculture gradient • Urban gradient • Forest—both gradients • Wastewater-treatment plant (WWTP) • Calculate biological metrics/indices • Calculate environmental factor values
DATA ANALYSIS APPROACH • Evaluate relations between biology and environmental factors • Spearman correlation • Scatter plots of biological metrics vs • environmental factors
ENVIRONMENTAL FACTORS IN PLOTS Land use Percent forest Total road density Nutrients Total phosphorus Nitrate Sediment Embeddedness Shading Canopy angle Stream geometry Bank height Biological metric Environmental factor
ENVIRONMENTAL FACTORS IN PLOTS Land use Percent forest Total road density Nutrients Total phosphorus Nitrate Sediment Embeddedness Shading Canopy angle Stream geometry Bank height
ENVIRONMENTAL FACTORS IN PLOTS Land use Percent forest Total road density Nutrients Total phosphorus Nitrate Sediment Embeddedness Shading Canopy angle Stream geometry Bank height
ENVIRONMENTAL FACTORS IN PLOTS Land use Percent forest Total road density Nutrients Total phosphorus Nitrate Sediment Embeddedness Shading Canopy angle Stream geometry Bank height
ENVIRONMENTAL FACTORS IN PLOTS Land use Percent forest Total road density Nutrients Total phosphorus Nitrate Sediment Embeddedness Shading Canopy angle Stream geometry Bank height
ENVIRONMENTAL FACTORS IN PLOTS Land use Percent forest Total road density Nutrients Total phosphorus Nitrate Sediment Embeddedness Shading Canopy angle Stream geometry Bank height
July-August 2011 May-June 2012
Rho=0.86 Forest site Agriculture site Urban site Agriculture site with wastewater-treatment plant Urban site with wastewater-treatment plant
Rho=0.72 Forest site Agriculture site Urban site Agriculture site with wastewater-treatment plant Urban site with wastewater-treatment plant
Forest site Agriculture site Urban site Agriculture site with wastewater-treatment plant Urban site with wastewater-treatment plant
Rho=-0.77 Forest site Agriculture site Urban site Agriculture site with wastewater-treatment plant Urban site with wastewater-treatment plant
Least disturbed Rho=0.63 Good Fair Poor Dauwalter et al., 2003
Summary Sampled 18 sites on small streams Gradient of agriculture and urban land use —also WWTP sites Effects on all trophic levels Effects from all classes of environmental factors Land use Nutrients Sediment Shading Channel geometry Effects from WWTP’s