Download
1 / 2
20 likes | 152 Views
Fig. S1. PBS MSCs NPCs. *. *. *. *. *. PBS MSCs NPC PSA-NCAM +. *. bFGF.

E N D
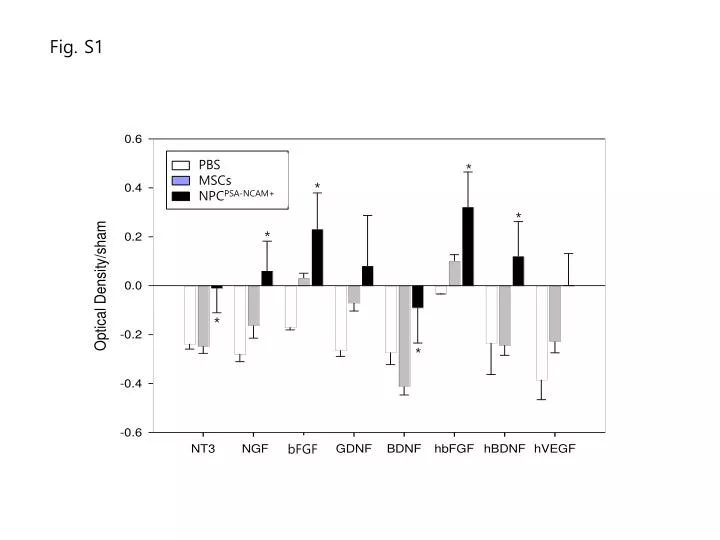
Fig. S1 PBS MSCs NPCs * * * * * PBS MSCs NPCPSA-NCAM+ * bFGF
Fig. S1 The expression levels of rat and human neurotrophic factors in ischemic brain were assessed using RT-PCR at day 26 after transplantation with NPCPSA-NCAM+, MSCs or PBS. A representative RT-PCR amplification of neurotrophic factors and the quantification of GAPDH-normalized mRNA levels to that of sham controls (baseline) (n=3 per group) are shown. Values are mean ± S.E.M. *P<0.05 when compared to those of PBS group.


![[Fig. S1]](https://cdn3.slideserve.com/6448662/slide1-dt.jpg)


